Say goodbye to cluttered maps, disjointed geospatial visualization and analysis that only tells you half the story.
Say hello to MapWeave – our new SDK for geospatial visualization, launching today for early access.
MapWeave takes our expertise in building graph and timeline SDKs to the next level: by making a geospatial visual analysis toolkit for powerful visualizations that reveal every connection.
Uniquely actionable geospatial intelligence
In domains like cybersecurity, financial crime investigation and law enforcement, investigators need to understand complex and evolving geospatial patterns. Where other tools fail to provide joined-up clarity, MapWeave brings unmatched insights.
The new SDK solves some of the toughest geospatial intelligence challenges, including:
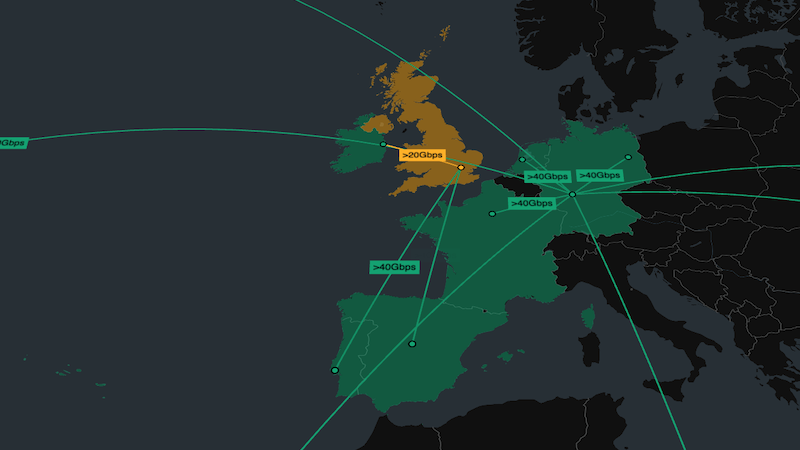
- Understanding cloud and network security threats across territories
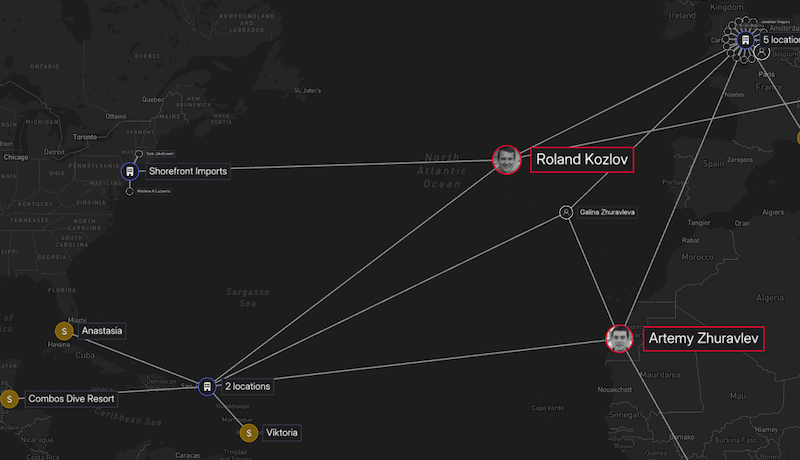
- Adding a geospatial dimension to complex OSINT investigations
- Tracking shipping movements and patterns for maritime intelligence
- Visualizing network digital twins with unparalleled spatial clarity
- Harnessing a suspect’s communications intelligence to unlock pattern-of-life and movement insights
Whether you’re tracking criminal networks across borders, investigating the movement of ships, or diagnosing a DDoS attack, MapWeave provides the clarity and joined-up analysis users need to solve complex problems.
Composable layers for unmatched geospatial views
MapWeave visualizations are powerful, scalable and multi-layered. They integrate network and observations data with geospatial information to create seamless user experiences that reveal patterns across time and space.
Bring clarity to geospatial link analysis
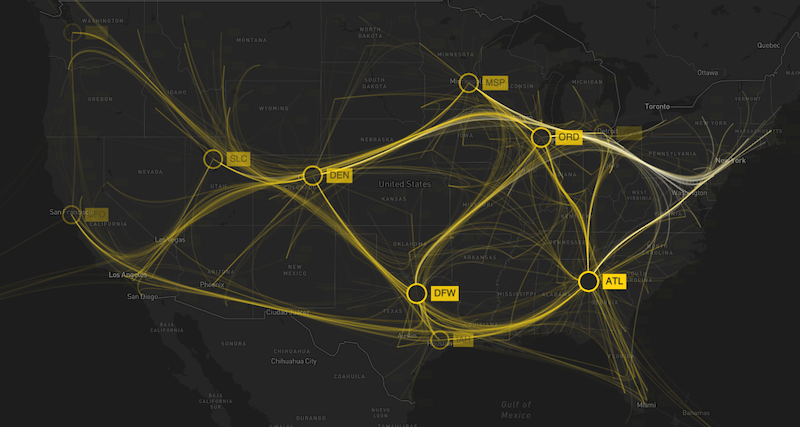
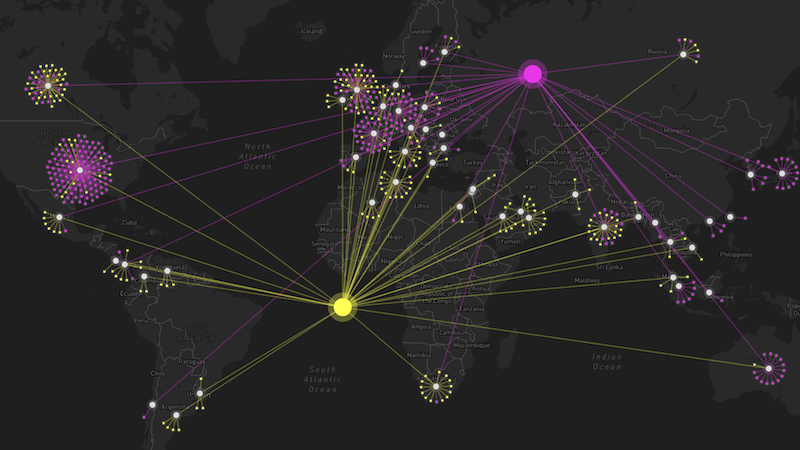
Connections are at the heart of many geospatial intelligence investigations. MapWeave’s Network Layer brings our market-leading link analysis to maps in a new way, revealing the spatial patterns analysts need to understand.
Unlike other geospatial visualization tools that create cluttered, unhelpful hairballs of densely-connected nodes, MapWeave brings clarity. It highlights critical connections in their geospatial context, giving analysts a complete picture without the noise:
- Maps combine geo-located and non-geographic nodes intuitively
- Edge bundling groups similar links into clear streams of connections
- Node clustering keeps closely-located nodes accessible, without clouding the overall view
- Smart adaptive behavior means every chart is beautiful and insightful at any zoom level
- Smooth transitions from high-level geographic views to detailed network views that focus on individual connections
MapWeave makes geospatial link analysis powerful, intuitive and beautifully clear.
Weave observations together
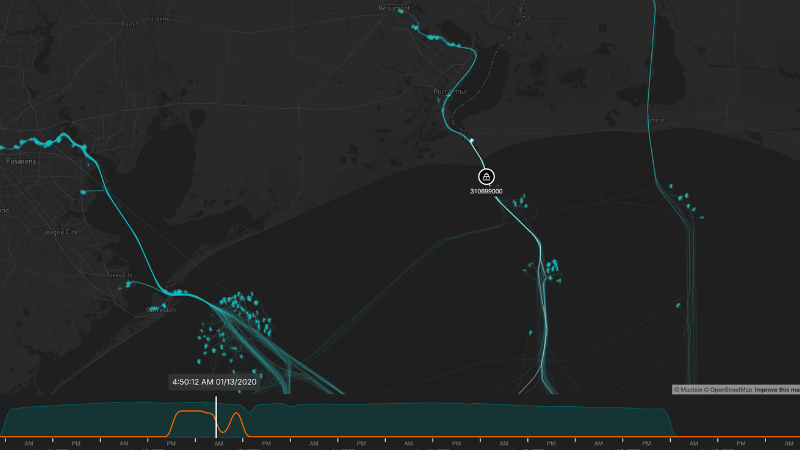
Observations data is vast, diverse and seemingly disconnected. It’s easy to collect, but difficult to interpret. MapWeave’s observations layer enhances raw data into clear trajectories, revealing otherwise hidden stories.
By plotting these paths at scale, MapWeave gives uniquely clear ‘pattern of life’ insights, showing how people, vehicles, ships, devices – or any other entity – behave over time. With unique “tracker nodes”, observations can play back in real time to show movements. Its GPU acceleration and efficient rendering handle over a million observations in a single visualization. Smooth real-time filtering and an interactive time bar bring the data’s story to life.
At this scale, tracking unusual flight or shipping paths, monitoring a suspect’s movements or analyzing convoy travel is a breeze.
Add spatial context and control
MapWeave supports standard data formats like GeoJSON, unlocking familiar ways to filter, expand and explore data on maps. With custom boundaries, highlighted regions and geofence-defined filters and selections, investigators can move at pace.
Altogether, MapWeave visualizations are a powerful data storytelling, analysis and investigation tool.
Modern DevX, supported by best-in-class integrations
Building visualization apps with MapWeave is simple. The SDK site contains fully-featured demos, example code, a fully-documented API – in both React and plain JavaScript – and quick-start guides to get your project off the ground fast.
We also have a growing range of pre-built basemap connectors and integrations – including Mapbox and MapLibre – so teams can keep the map assets, tile servers and data services they already use.
Multiply insights with easy integration with KeyLines, ReGraph or KronoGraph
MapWeave is designed to work effortlessly alongside our other SDKs, making it easy to build rich, interconnected data visualization experiences.
For example, investigations could begin in MapWeave – tracking movement patterns on a map – before pivoting to KeyLines or ReGraph for a deeper link analysis workflow. Or users might start with a KronoGraph heatmap to pinpoint key periods, before switching to MapWeave for spatial context.
By combining multiple SDKs, you can discover new ways to explore, analyze and investigate complex data, creating market-leading applications that turn complex data into clear intelligence.
How to get started
MapWeave is now in Early Access, with General Availability scheduled for later in 2025. Want to be among the first to try the new SDK? Sign up here to join the early access program.


