
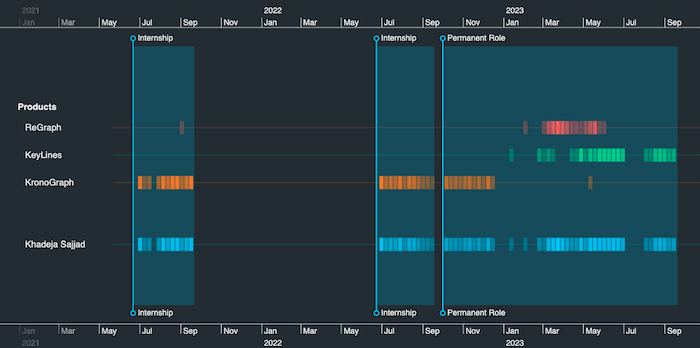
Software developer Khadeja joined us as an intern in 2021 and 2022, and made a great impression straight away. Her colleague Phil commented: “Some people become good developers through natural ability, others through sheer hard work. Khadeja combines both.”
In October 2022 she joined us as a permanent member of the team, designing and implementing new features for our toolkits. We were so proud when she secured a place at University of Oxford – but we’re all sad to see her go. We asked Khadeja to share her reflections on her time with us.
I still remember the excitement I felt when I wrote my first program, and saw the legendary words “Hello World” pop up on my screen. It was the start of an adventure that has taken me from Pakistan to Italy and then Loughborough, where I distinguished myself as the top student with a BSc Hons in Computer Science.
I’ve always been hungry to learn more, searching for new and challenging experiences. And cutting-edge technology lights a fire within me.
In the summer of 2021, I was in the second year of my BSc. With my background in web development and JavaScript, I had options – but an internship with Cambridge Intelligence was special as it promised to immerse me in the fascinating world of data visualization, a field I had explored during my research projects at Loughborough University.
After two awesome internships, I was invited to join my friends as a permanent member of the software team. This gave me the opportunity to cultivate a diverse range of skills, from mastering Agile Development processes to refining my expertise in API design. Working on various projects, I significantly elevated my expertise in TypeScript and JavaScript.
But now I’m moving on to start a Masters at Oxford – and the time has gone by so quickly. I can’t believe how much I’ve managed to fit in during my tenure with Cambridge Intelligence – coding for market-leading graph and timeline visualization products, as well as testing out my own ideas and theories. Looking back at some of the Friday Projects I’ve worked on, I can’t help seeing them as an illustration of my experience. (Friday Projects are a weekly opportunity to step away from the roadmap and explore the potential of our toolkits, trying out new ideas).
My Friday experiments with Cambridge Intelligence’s unique data visualization toolkits started with a fun fraud visualization app.
I built a hybrid application that spots fake Amazon reviews, using graph and timeline visualization technology:
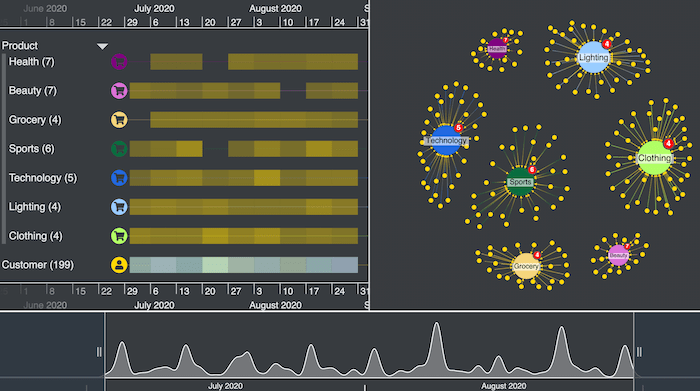
I used fictitious elements in my dataset to replicate the way fraudsters work. The app was a great example of how fraud analysts can use interactive visualization components to power up their investigations.
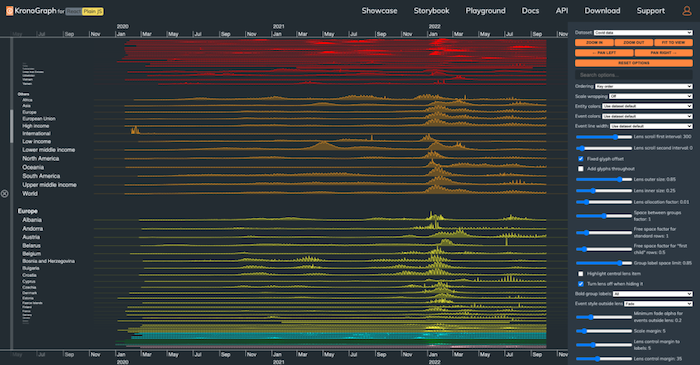
Working at home during Covid, I tried out a fun new feature idea for KronoGraph – time series charts on entities. This made it easier for me to illustrate the worldwide impact of the pandemic from 2020 to 2022 effectively and comprehensively:
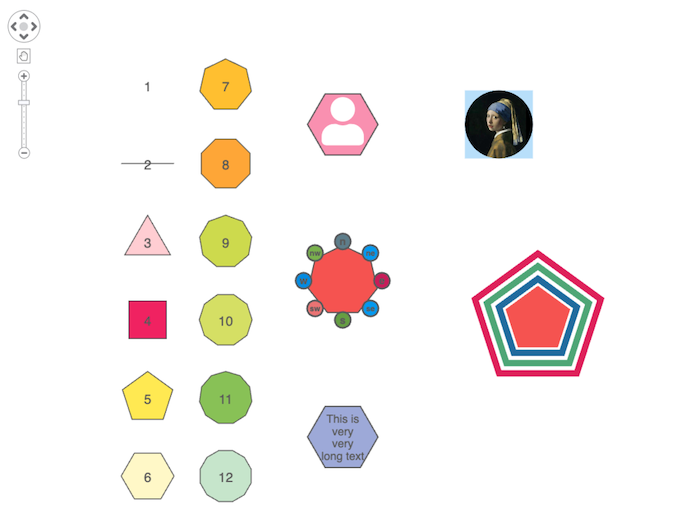
Graph styling reached new levels in the same year, when a major update brought almost limitless customization options, empowering users to craft charts as uniquely beautiful as their imagination could muster. Now that nodes no longer had to conform to the usual circles or boxes, one fabulous Friday I came up with a feature for KeyLines that made it possible to specify the number of sides for a polygon-shaped node:
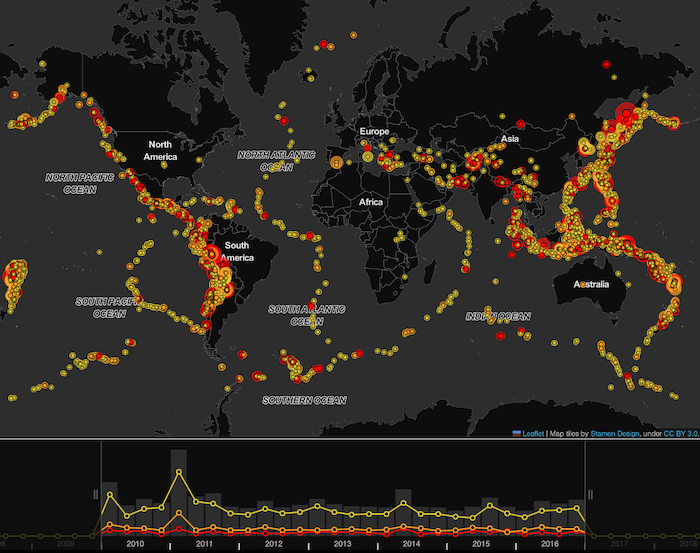
2023 saw one of the most destructive earthquakes in history. The 2023 Turkey-Syria earthquake caused at least 59,259 fatalities. I used pattern analysis and mapping technology to explore earthquake activity across the world from 2010 to 2016. You can’t predict or prevent a natural disaster, but I looked at how data visualization can help us understand risks, and learn from previous events. You can see more screenshots, and more info about this Friday project in my blog, “Understanding earthquakes: what map visualizations teach us”.
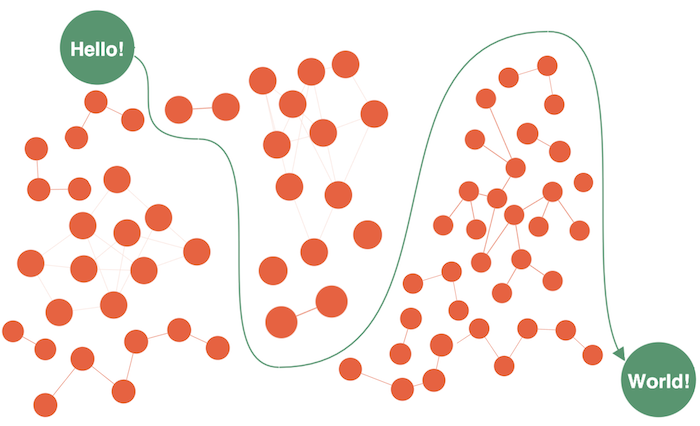
Let’s revisit our beloved “Hello World” – where it all started. I employed aggregated Bezier curves to create a snake-like link. This nifty trick comes in handy when you need your links to gracefully avoid overlapping nodes: just like in our example, we make sure that the link from the node ‘Hello’ to the ‘World’ doesn’t interrupt anyone.
Data visualization isn’t just about crunching investigations; sometimes it can be an artistic explosion! My university research focused on L-systems, a fascinating concept in biological development. With the skills I gained at Cambridge Intelligence, I could draw and render these intricate systems in a web browser:
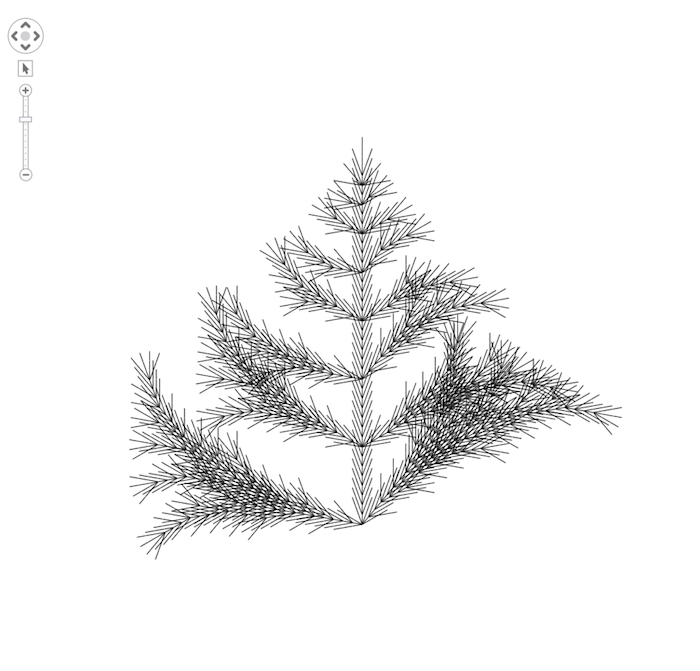
A chart that looks like a fern or a majestic tree starts from a single seed node and branches out organically. It’s not just a thing of beauty – it’s practical too. This chart contains a vast number of nodes, making it a stellar example for performance testing. It’s a reminder of how I’ve blossomed through my programming adventures – and I can’t wait to experience the new challenges waiting for me at Oxford.
They say that once you lean into your passions, you can’t go wrong. If you’re looking for an internship or graduate developer role where you can learn every day, and work with cutting-edge tech and lovely people – I definitely recommend Cambridge Intelligence.
Do you want to join a forward-thinking organization and get involved in developing industry-leading technology? Check out our careers page
Share: