Our node grouping and combining feature (combos for short) is one of the most used tools in our graph visualization SDKs.
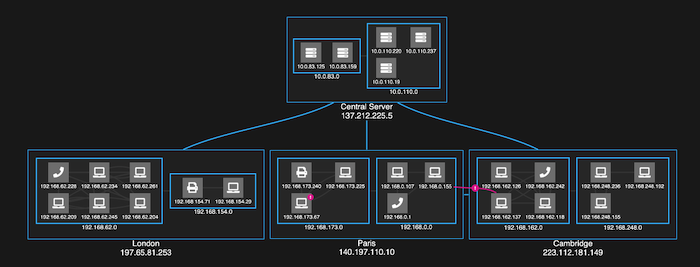
With our latest releases of KeyLines, our JavaScript graph visualization SDK, and ReGraph, our graph visualization SDK for React developers, you can now create eye-catching and space-saving rectangular combos.
The latest toolkit updates also include more compact combos, a revised KeyLines Neo4j tutorial, and ReGraph support for the latest version of React.
Rectangular combos are here
They don’t just look good: rectangular node and link combos are the best choice when space for nodes and links is tight. Combined with the new grid arrange option, you can make efficient use of chart real estate and place nested combos into neat blocks. And you can still apply custom styling to achieve the look and feel you want.

Combined with our sequential graph layout and curved links, users can create slick and stylish visualizations that provide clarity.
To help you get started with rectangular combos, we’ve updated the KeyLines SDK’s Combos Basics demo and added a new Arranging IT Networks demo. In ReGraph you’ll find a brand new Rectangular Combos story.
Want to see rectangular combos in action?
Rectangular combos are currently in alpha development, so if you have feedback, please get in touch.
Compact circular combos
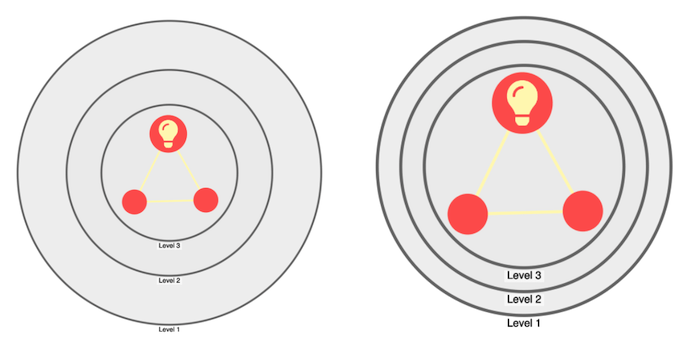
Chart items inside rectangular combos use just the right amount of padding so as not to waste valuable chart space. We’ve applied this to circular combos too.
The result is a much tighter view that focuses on the items that matter and reduces whitespace. It’s particularly effective when there’s a small number of nodes in a combo, or you have multiple nested combos but only one contains chart items.

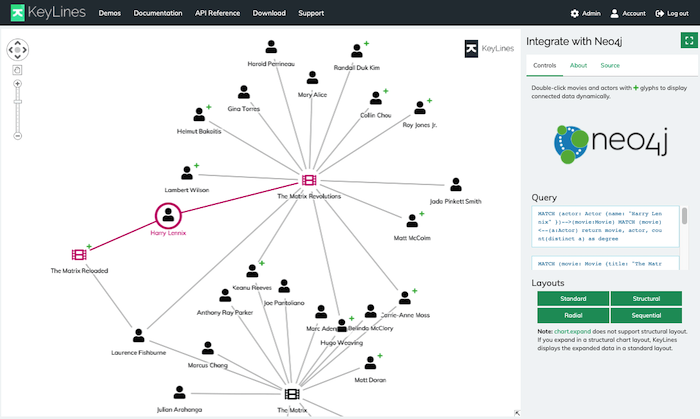
KeyLines: demo upgraded to Neo4j 4.1
The integration tutorials and demos on our KeyLines SDK offer quick and easy ways to integrate with your favorite graph database. We’ve just updated our most popular database demo to use Neo4j Database Enterprise Edition 4.1.

ReGraph: support for React 17

ReGraph, our graph visualization toolkit designed for React developers, now supports React 17. This version lets developers enable gradual React upgrades, giving them greater control over how to migrate to future versions.
KronoGraph v1.0 released!
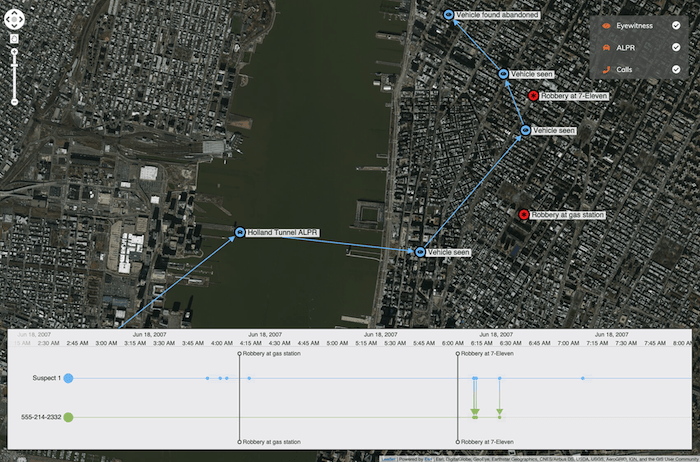
We’re delighted that KronoGraph, our timeline visualization toolkit that drives investigations, is now at version 1.0 and available as a commercially-licensed product.
100+ JavaScript and React developers from prestigious security and anti-fraud organizations worldwide were the first to try KronoGraph during our successful early access program.

Reaching the v1.0 milestone means timeline visualization applications built using KronoGraph can now be shipped to customers. It works seamlessly with KeyLines and ReGraph, giving users the ability to explore connections and analyze time-based events simultaneously.
Learn more about KronoGraph
Try our data visualization toolkits
Our toolkit technology gives you the power to build the data visualization applications your users need to find insight. Interested? Request a free trial


