The simpler your UI, the sooner your users can find insights in their connected data and make business-critical decisions. So don’t make them decode “Transportation type: Road” when a truck symbol tells them everything. Font icons give users instant, universal cues: no translation needed, no mental overhead.

Icons tell the story: The handover that went wrong
This IT support case has dragged on for weeks. The client keeps emailing an agent called Talia, but she’s on holiday. Look at this timeline visualization and you’ll understand what happened without scanning through multiple text labels. The icons help tell the story: an initial video call and a quick exchange with another agent before Talia goes on holiday, followed by a series of unanswered emails from the client – which explains the critical delay status of the case. We’ve color coded the different types of communication, helping users to spot the green agent-to-agent handover where the key breakdown occurred.

That’s the power of font icons – they deliver meaning at a glance. Time-to-insight is a key quality metric for your application, whether your users are fraud analysts sifting through months of data, or cyber security teams analyzing threat alerts.
Icons declutter without losing content
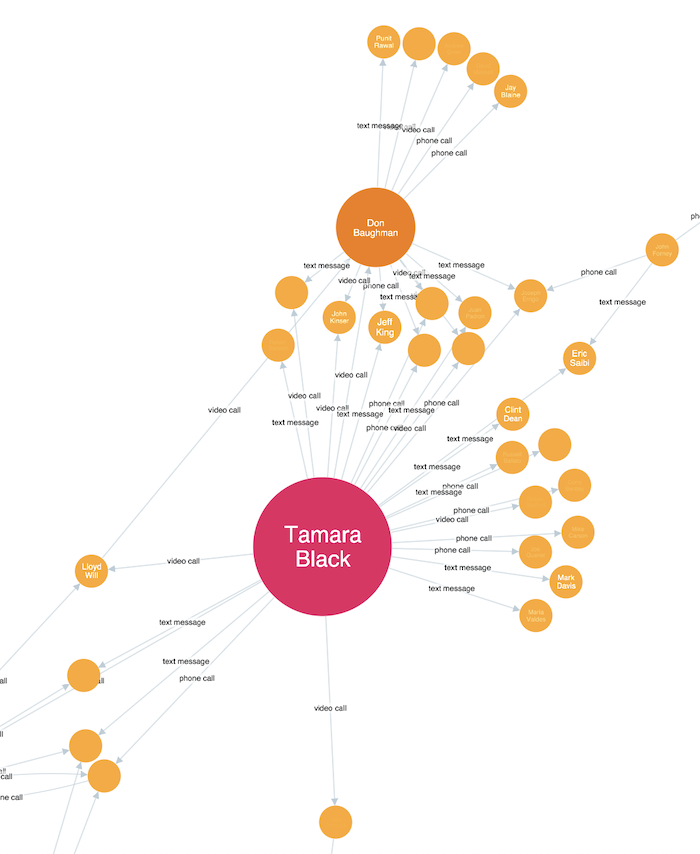
Here’s a social network showing colleagues communicating via phone, video call and text message. The node sizes represent their degree in the network. But long link labels overwhelm the user, obscuring each other and becoming too small to read at this zoomed-out view:
Here’s the same chart, with icons representing communication types:

The UX transforms. Font icons declutter the data without losing content. Communication patterns emerge, team structure is clearer, and users can explore their data freely instead of struggling to make sense of every element.
Icons reveal patterns
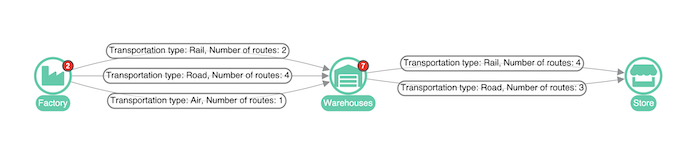
Let’s look at a different use case. Supply chain visualization adds visibility to bottlenecks, letting teams streamline processes and predict disruptions. This is a visualization of routes from factories to stores via warehouses, with text labels showing modes of transport:
Replace the labels with truck, plane and train icons, add some strategic color and link width, and the patterns jump out:
Your database might store “Transportation type: Air, Number of routes: 1” but your users don’t want to read raw data. Give them a number 1, and a plane, and let them uncover insights and make decisions.
Why do font icons work so well in graph visualizations?
Beyond the visual clarity we’ve seen in these examples, font icons have technical advantages that make them ideal for graph visualization. As we’ve seen, text labels can become illegible when you zoom out, making it harder to spot patterns and relationships across your data. Icons remain recognizable even at smaller sizes, giving users visual anchors as they explore.
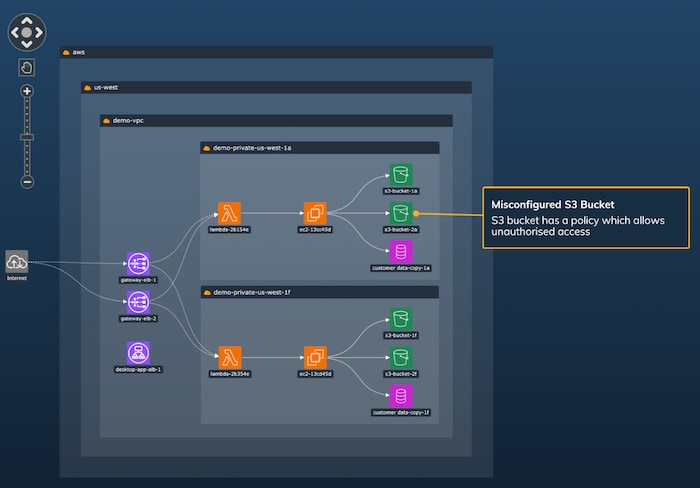
In cyber security environments, icons support visual understanding without cluttering the view. In this AWS cloud environment, Lambda functions, EC2 instances, data storage, and load balancing gateways are all represented with their standard service icons. Repeated icons indicate multiple nodes of the same type, and color is used to reinforce these node types and create continuity within the chart.
A node labeled “Email Server” requires reading and processing text. But look at an envelope icon and your brain registers “communication” before you’ve even consciously thought about it. And when you see that envelope repeated across other nodes, pattern recognition kicks in automatically.
This cognitive advantage becomes critical in high-pressure scenarios. When you’re analyzing security impact across an entire network, icons are essential. In this impact analysis demo, alert styling in red and yellow immediately shows where the impact of the threats is concentrated, and contrasting glyphs draw your eye to the alerts – no need to read status labels or hover over every node. Users can scan hundreds of connections and instantly identify the paths that need the most urgent attention:
Icons are just one element of thoughtful graph visualization design. For a deeper look at UX principles and pitfalls, check out our guide to avoiding common graph visualization UX mistakes
Tips for using font icons
Use familiar symbols. Stick to icons with clear, widely understood meanings. A phone is a phone, a truck is a truck, for everyone. Having said that, do consider validating your choices with user feedback or A/B testing.
Don’t overload. Limit any single chart to a few icon types. If you think you need twenty different icons, you probably need to review your data model. Use tooltips to give users added detail on demand.
Use color and shape. Consistent color coding and thoughtful node styling reinforce the user’s understanding of the chart as a whole.
Getting started
KeyLines, ReGraph and KronoGraph all support font icons on nodes, links, glyphs, entities and events. You can integrate any web font icon library – our SDK sites have tutorials and examples to get you running quickly.
FAQ
What are font icons?
They’re scalable vector symbols loaded as fonts. They contain symbols instead of alphanumeric text, and they render crisply at any size.
Why use font icons instead of SVGs or images?
You can use SVGs and images as an alternative, but you’ll find font icons slightly more performant when working with our graph visualization toolkits – and they’ll integrate seamlessly with the web fonts you’re probably already using.
Which icon libraries work best?
Font Awesome and Material Icons are popular and reliable, with thousands of consistent symbols. Or create your own custom set for domain-specific needs.
Are font icons good for accessibility?
Yes, if you implement them properly. Read more about improving accessibility in your graph visualization tools


