Most of our customers use KeyLines to uncover insight for critical issues like fraud investigation and detection, law enforcement and cyber security threat analysis. However, that’s not to say that graph visualization can’t be used for more light-hearted goals.
We found this Github Gist dataset and, with the World Cup in full swing, we thought it would be fun to visualize it.
KeyLines Kick-off
The dataset is made up of all the football (soccer for our American audience) players participating in the 2018 World Cup and their associated club and country. The players, countries and clubs are represented by nodes and the links connect an individual to their team and country.
We entered the data into a chart using KeyLines, our graph visualization SDK for JavaScript, and this is what we saw:
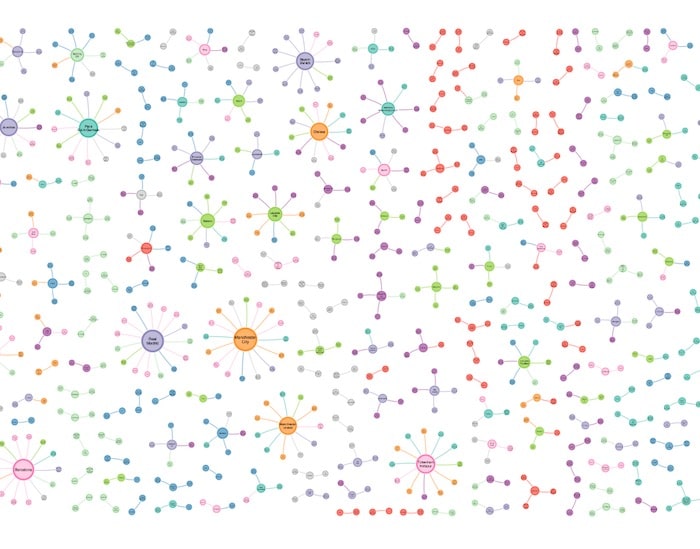
As it stands, this graph is quite Messi. Using combos, the node-grouping functionality, we’re able to group the players by their country, instantly reducing some clutter.
By grouping the players by their countries, we now have a clearer overview of the graph and can begin to dig deeper for more information.
To help us filter out the noise, KeyLines brings the selected data to the foreground, hiding or ‘ghosting’ the rest of the items in the chart, making it easier for us to focus on the area of interest.
Using nested combos – combos inside combos – we can browse the chart at different levels. This helps uncover overall graph trends without losing insight into individual nodes.
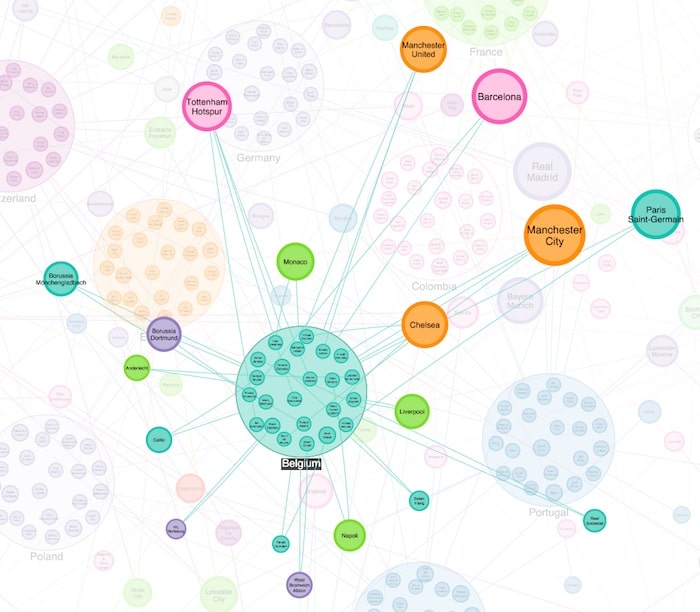
If we focus on the Belgian team, we can see the individual players inside the combo and the clubs they play for. Their squad is made up of players who play for teams in different leagues including the British, French and Spanish leagues:
The England squad, on the other hand, has less variety with the majority of their team playing in the British league:
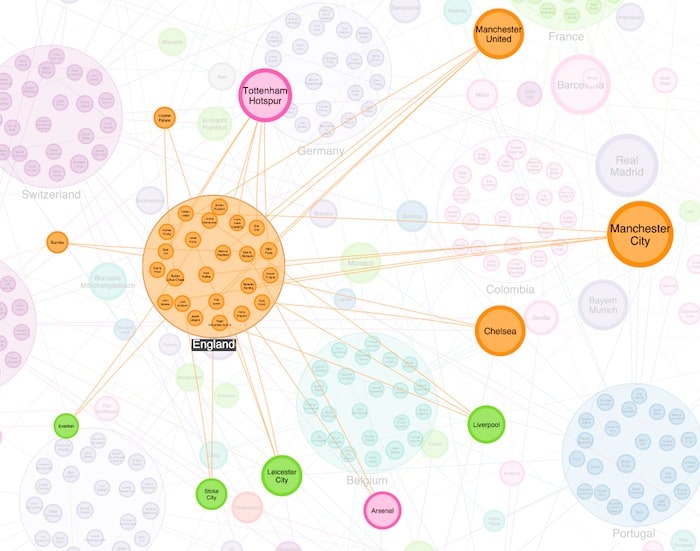
Using KeyLines SNA measures, we can resize the nodes based on their importance. Here we’ve sized them based on their EigenCentrality – a measure of influence. This helps us quickly spot the clubs that most of the England players play for.
Score with KeyLines
If there are connections in your data, you can visualize them. From World Cup and taxi cab data to IT networks, KeyLines can help you uncover insight. Don’t get caught off-side with your graphviz, sign up for a KeyLines evaluation here.


