The cryptocurrency & blockchain visualization challenge
Cryptocurrency is showing signs of going mainstream. Its increasing popularity means the market size is expected to reach $2.2 trillion by 2026.
But it’s also intangible and highly volatile. It presents difficult challenges for governments, anti-money laundering (AML) analysts and financial crime investigators, as well as virtual asset service providers (VASPs) complying with strict regulations.
They need to clarify complex and dense blocks of transaction data fast to identify high-risk activity.
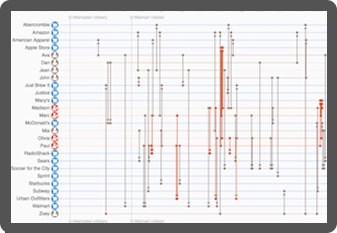
Analysts need data visualization – particularly link analysis and timeline visualization – to understand cryptocurrency exchange patterns and anomalies.
Let’s explore why.
Blockchain visualization
Organizations use our SDKs to build products that make sense of blockchain, the technology used by cryptocurrencies. They recognize that effective cryptocurrency data analysis relies on blockchain visualization tools to reveal hidden insight.
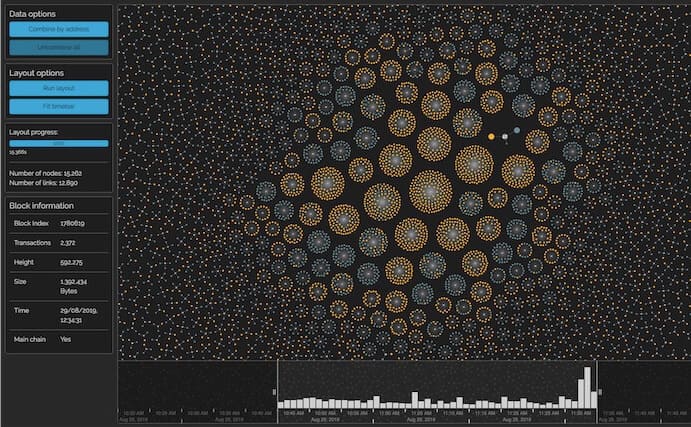
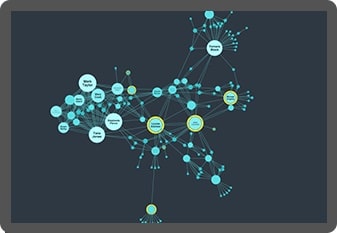
In its simplest form, blockchain is a vast and complex series of transaction events between entities. Those events – or connections – are easier to understand when they’re presented in an interactive, tangible format.
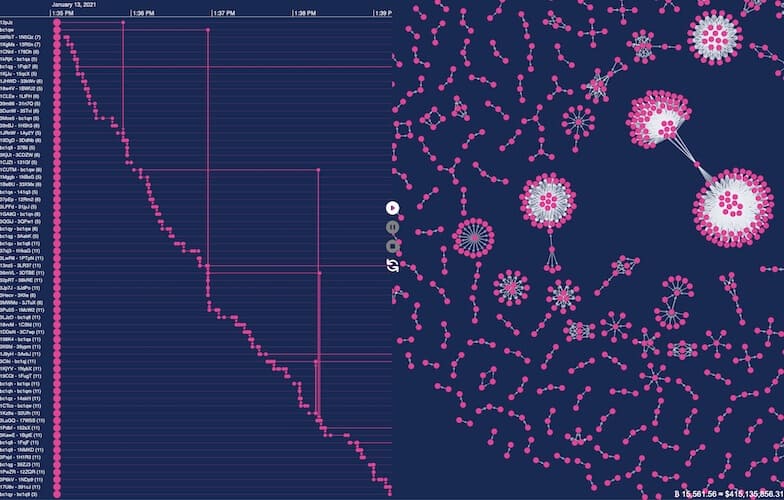
Presenting blockchain data as graph and timeline visualizations makes it accessible and comprehensible. It helps analysts reveal patterns of unusual activity hidden in high traffic volumes, as well as drill down to understand the details of individual transactions.
Learn more about cryptocurrency and data visualization
Blockchain visualization for law enforcement
Law enforcement agencies need to understand the activities of actors in a blockchain network. They use blockchain visualization and analysis tools to investigate, classify and monitor blockchain addresses and transactions.
Criminals choose cryptocurrencies, like Bitcoin, because they offer an anonymous, secure, low-cost way to transfer funds quickly. They use it to trade on the darknet, fund terrorism, or carry out ransomware and extortion campaigns.
To investigate criminal activity, you need data visualization technology that’s powerful enough to tell the whole story.
Blockchain visualization for government agencies
There’s an ecosystem of cryptocurrency platforms for trading coins and exchanging them for fiat currency. Virtual Asset Service Providers (VASPs), like exchanges, must comply with each jurisdiction’s anti-money laundering (AML) regulations. Most VASPs need to understand who is using their platforms and how, and are required by law to report suspicious activity.
But tracking the movement of illicit funds is a huge task as criminals use increasingly sophisticated money laundering techniques. Blockchain data company Chainalysis estimates that $8.6bn of cryptocurrency was laundered in 2021, up 30% on the previous year.
Building a live Bitcoin viusalizer dashboard & analysis tool
Blockchain visualization for financial regulators
Many agencies in the financial services industry work with cryptocurrencies directly, or as suppliers to (and regulators of) VASPs. That requires a deep understanding of the risks posed by potential clients.
Robust Know Your Customer (KYC) policies are needed to verify identities and keep the digital assets of legitimate investors secure. To conduct the highest level of due diligence, analysts need to understand the complex connections in the blockchain. But how do you untangle such a complicated web of transactions?
Blockchain visualization doesn’t mean showing everything in the application at once and trying to make sense of it. With clever filtering techniques, you can eliminate clutter and focus on a particular value threshold or time range.
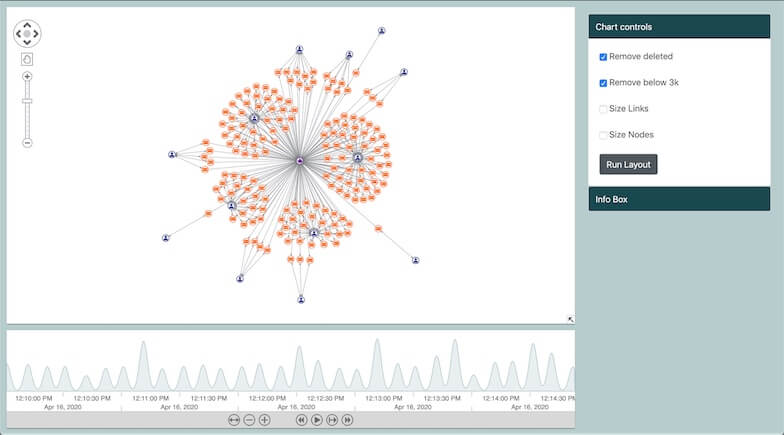
It’s also important to follow Know Your Transaction (KYC) best practices to understand how digital funds flow between different cryptocurrency exchanges and which fiat currencies they’re associated with.
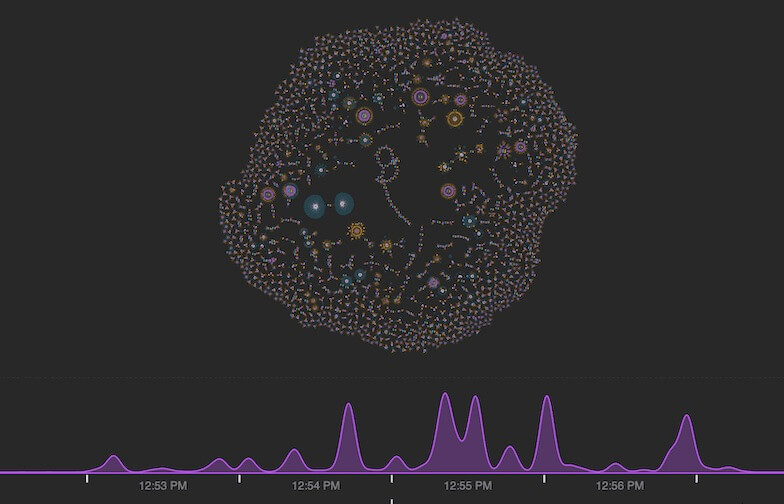
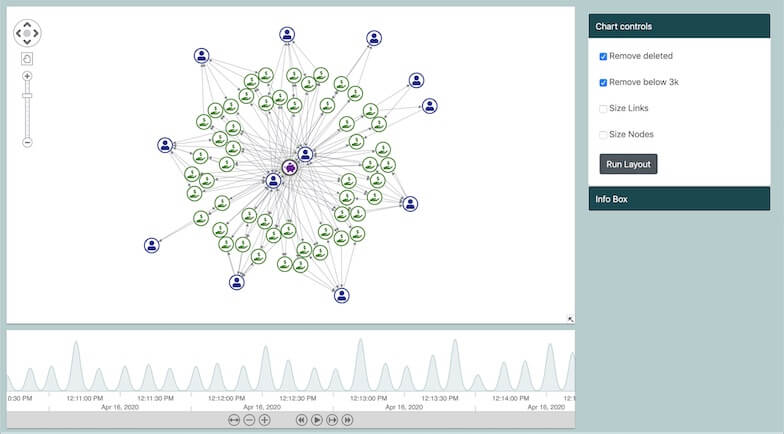
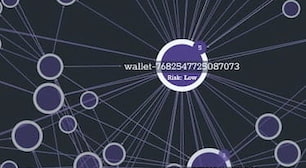
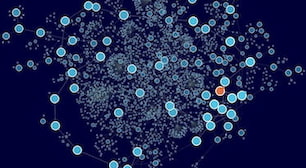
In this blockchain visualization, the green cluster shows consecutive payments happening between multiple user accounts, but all linked to a central issuer of Bitcoin to Ripple transactions whose funds were exchanged from Chinese Yuan.
Custom cryptocurrency & blockchain visualizations
Our technology has helped organizations around the world develop their anti-money laundering and financial fraud detection systems.

Trace transactions
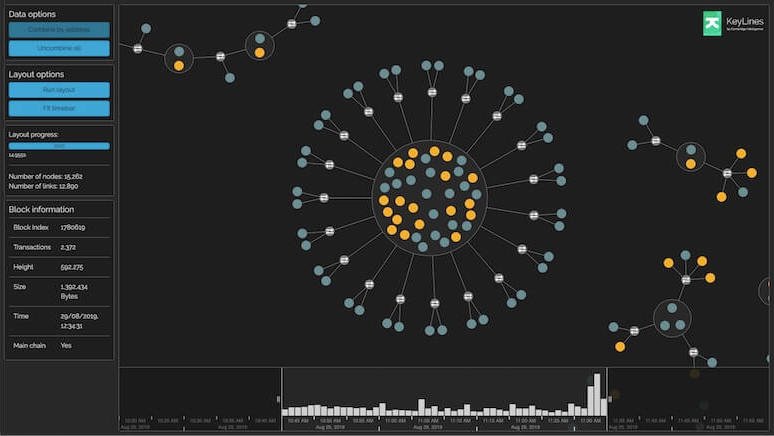
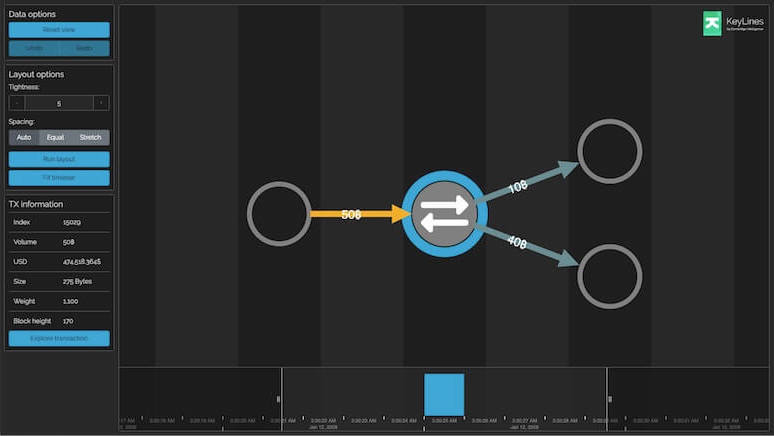
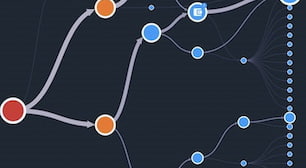
Follow the flow of transactions between addresses, wallets and exchanges. Querying, collating and exploring blockchain events as a network of linked connections makes this process simpler and more effective.

Examine patterns
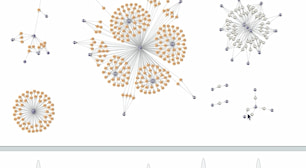
Explore blockchain visualizations to reveal patterns and unusual behaviors in intuitive and interactive ways. Reveal the exact sequences of transaction events, how they unfolded and how they’re connected.

Simplify complexity
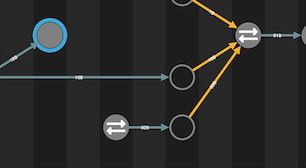
Bitcoin handles around 2,700 transactions in a single block, with a new block created every 10 minutes. With this volume of data, investigators need the right visualization tools to filter, group, highlight and identify the transfers that need closer attention.

Customize visualizations
Create beautiful network visualizations that match the style of your investigative application. You can customize every item and interaction, then give analysts the power to export annotated reports as high-res images or PDFs to share with the team.
Want to try it for yourself?
KeyLines
The graph visualization SDK for JavaScript developers
KeyLines is your fast-track to graph visualization success on any tech stack.
ReGraph
Hassle-free graph visualization for React developers
ReGraph for React makes building state-based graph visualizations a breeze.
KronoGraph
Advanced timeline visualizations that scale quickly & easily
Build advanced interactive timeline views, customized for your applications.
MapWeave
Geospatial visualization SDK that uncovers every connection
Build apps that make geospatial connections clear and insightful.
Blockchain visualization blogs
9 techniques for your blockchain analysis tool and investigations
Some graph and timeline visualization capabilities to consider when building a blockchain analysis tool.
WannaCry analysis: visualizing their ransomware attack
We explore how data visualization tools can detangle cryptocurrency transactions involved in ransomware attacks.

Bitcoin visualization: analyzing a charity’s success with crypto
How a charity used bitcoin visualization to boost donations values by almost 300%.
Next.js data visualization for faster graph visualization apps
Implementing an investment recommendation engine to decide on best currencies.
Cryptocurrency AML: compliance & blockchain
How link analysis can help cryptocurrency exchanges and financial institutions to identify high-risk accounts.
Understand your Bitcoin transaction visualization
Exploring the uses of graph visualization to understand cryptocurrency.
