Why HTML5 Canvas?
Over the years, different ways to visualize data have gained (and lost) traction as browser technologies have evolved. As developers, we’ve worked (and sometimes fought) with plugins like Flash and Silverlight, approaches like server-side rendering and direct DOM manipulation, and the declarative approach of SVG.
WebGL rendering is a newer technology that builds on Canvas to leverage modern GPUs, But HTML5 Canvas is still popular. It has a winning combination of widespread browser support, good performance, and a bitmap-oriented approach that provides considerable flexibility.
Visualizing data with HTML5 Canvas
When you are working with Canvas as a developer, you create a canvas object and a drawing context in JavaScript, and use the Canvas API to draw things into it. Behind the scenes, the canvas object contains a bitmap that the scene is drawn into.
With modern browsers, it’s quite possible to draw a fairly complex scene in less than 16 milliseconds, which means you can achieve a frame rate of 60 Hz, giving beautifully smooth, flicker-free animations.
The relative simplicity of the bitmap-oriented approach also means that the different browser implementations are (mostly) pretty consistent, which reduces the number of browser-specific problems that you run into.
Using HTML5 Canvas for advanced visual techniques
The bitmap nature of Canvas also makes it possible to achieve a number of special effects using our products that would be more difficult with other approaches. Here are a few examples:

- make circular cut-outs from rectangular images by drawing the image into a canvas and then doing pixel-level manipulation of it
- make an encoded PNG image of a chart by drawing the chart into a separate canvas, then extracting the bitmap data from the canvas
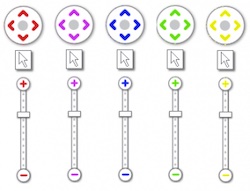
- changing the navigation control colors by recoloring pixels in a canvas
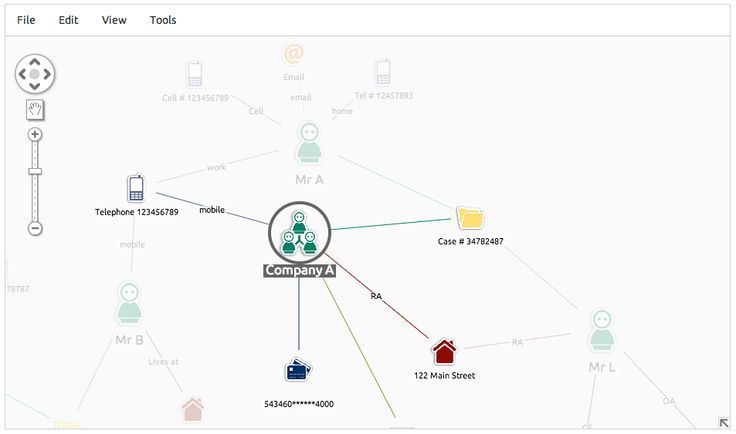
- creating items with a ‘faded-out’ effect by drawing the chart scene to a separate canvas, then drawing the resulting bitmap in turn to the main canvas while applying an alpha value to achieve the fading:

Overall, Canvas is a mature and well-implemented technology that is a great choice for visualization in the browser today. Of course, web technology is always evolving, and we’ll certainly see new developments in visualization in future browsers.


