FREE: Graph visualization and artificial intelligence white paper
Find out how successful businesses work with the latest graph visualization and AI technologies to make fast, business-critical decisions.
Artificial intelligence promises a positive shift in practice for businesses across domains from cybersecurity, intelligence and anti-fraud to supply chain and pharma. They’re turning to AI graph analysis to reveal risks fast.
But AI has also brought new challenges.
“Industries relying most heavily on knowledge work are likely to see more disruption [in the next three years] — and potentially reap more value. [Our] estimates suggest that tech companies are poised to see the highest impact from gen AI — adding value equivalent to as much as 9 percent of global industry revenue.” (The State of AI in 2023 – McKinsey)
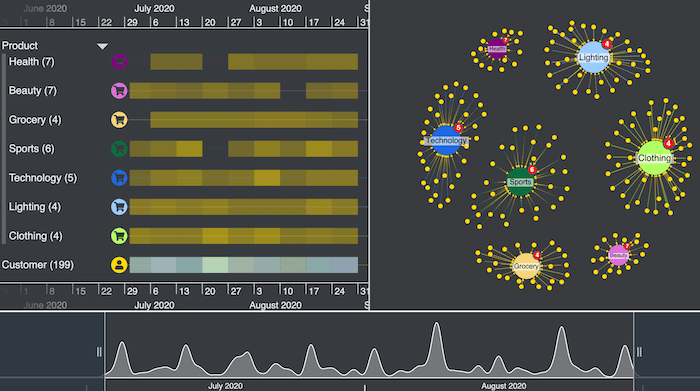
Our white paper, Graph visualization and artificial intelligence, looks at how successful businesses use AI graph analysis in their investigative worklflow. They use AI and data visualization tools together to uncover insights in their complex connected data, and make fast, business-critical decisions. It shows how AI graph analysis can:
Save time and money: AI can enhance graph analytics applications. It can automate the heavy lifting to get the job done fast, giving teams a head start on their data analysis project.
Improve UX: AI insights brought to life with graph visualization make instant sense to the user, so they get straight to the heart of a problem.
Reduce human error: With AI performing repetitive tasks that don’t require human judgment, analysts are less likely to make the wrong call on quick decisions.
The white paper examines how AI graph analysis needs to play to the different strengths of graph visualization, AI technology and human reasoning.
The ideal approach is to apply machine learning to give structure to your data, and then let human managers analyze and explore it using an interactive visualization. The intelligence cycle looks like this:
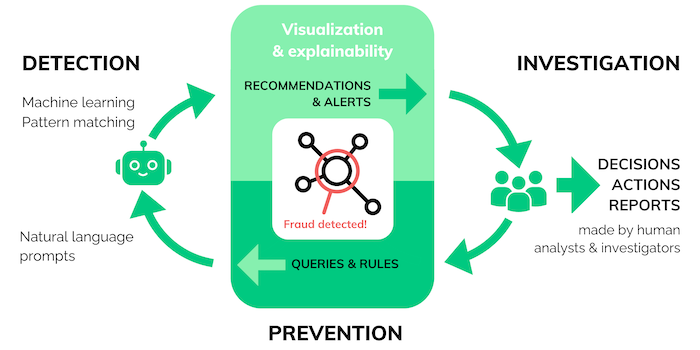
Detection
AI software gathers, cleans and structures data from disparate sources and silos. It uses machine learning and pattern recognition to make recommendations and raise alerts.
Investigation
Interactive graph visualization presents these insights in a way that makes it easy for investigators to navigate and analyze, turning it into actionable intelligence.Prevention
Investigators use what they’ve learned to inform the next set of queries and rules they feed into the system – perhaps using natural language prompts to speed up the process.Download our white paper to see real-life examples of how the graph and AI intelligence cycle works in practice. We also look at AI-driven risks and threats, and see how AI graph analysis combats fraud and cyber attacks.
Find out how successful businesses work with the latest graph visualization and AI technologies to make fast, business-critical decisions.
Registered in England and Wales with Company Number 07625370 | VAT Number 113 1740 61
6-8 Hills Road, Cambridge, CB2 1JP. All material © Cambridge Intelligence .
Privacy Policy | Security Framework


