The supply chain data visualization challenge
Global companies rely on efficient and traceable supply chains.
Inefficiencies and bottlenecks increase waste and make it harder to adapt to changing demand. A lack of visibility creates operational delays, increases customer anxiety and limits the organization’s ability to achieve and prove regulatory compliance.
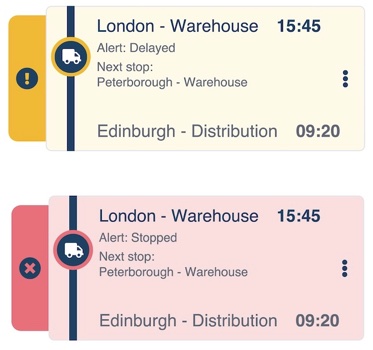
As a result, businesses are digitizing their supply chain processes. Often combining IoT sensor technology with machine learning and real-time data analytics, modern supply chains track products from supply to production to distribution, and all the steps in-between. Data visualization is a key part of doing this right.
Who needs supply chain data visualization?

Retail & manufacturing
If a product is unavailable, or its delivery status can’t be tracked in realtime, customers take their business elsewhere. For retailers and manufacturers, getting products to the right place at the right time is a fundamental business requirement.

Government & defense
In a high-stakes environment, like a military exercise, huge volumes of critical supplies are shipped across long distances, ready to arrive to a precise schedule. There’s often heavy stakeholders involvement too, making government supply chains some of the most complex around.
Healthcare & pharmaceuticals
Every organization needs a fast, reliable and secure supply chain. That’s especially true in the healthcare and pharmaceutical industries, where lives depend on supplies being available at the point of need.
Analysts need interactive data visualization – especially graph visualization and timeline visualization. They’re the best tools available to make sense of complex supply chains.
Let’s see why.
Supply chain visibility
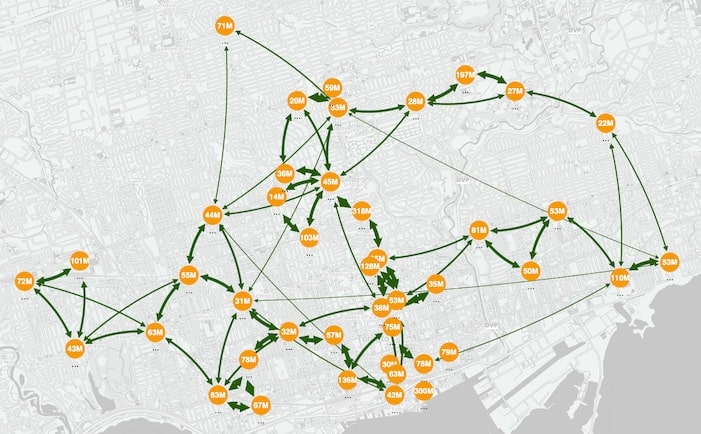
End-to-end visibility of the supply chain in real-time: it’s what every organization strives for. There’s no shortage of information available, with data streaming in from sensors, checkpoints and scanners. The challenge is turning that data into clear and useful insight that a supply chain manager can make sense of.
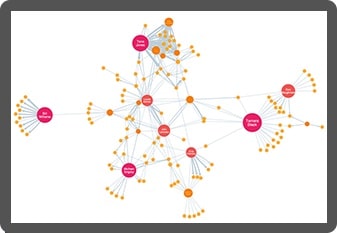
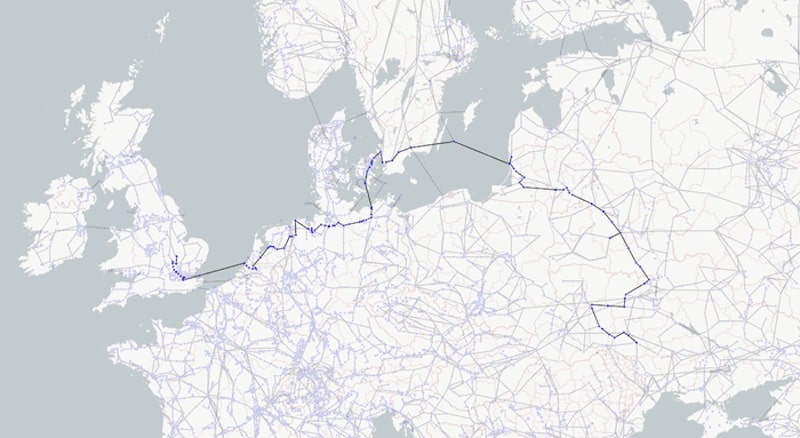
Graph visualization simplifies complex connected supply chains, reveals patterns and clarifies large volumes of data into a single unified view. In this example, we’ve visualized the complex network of energy pipelines routing electrical pipelines across Europe, and easily identified the shortest path between Ukraine and the UK.
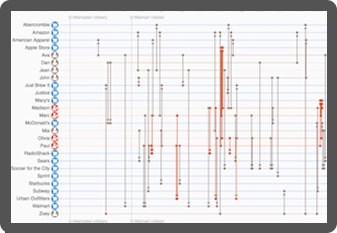
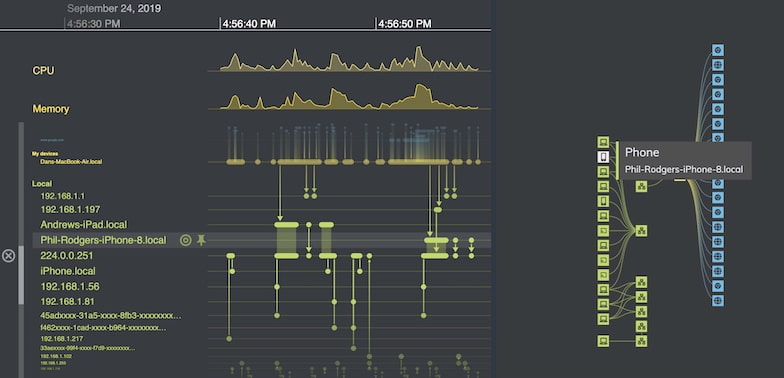
Combined with timeline visualization, supply chain managers and analysts quickly make sense of supply chain activity, and get a clear view of what’s happening.
Free white paper: supply chain visualization
Modern supply chains are big, complex networks with many moving parts. This white paper explores how graph analytics make supply chains easier to understand and optimize.
Uncovering bottlenecks
Supply chain inefficiencies cost money: products get stuck in warehouses, delivery vehicles leave depots half full, and customers are left disappointed.
The only way to uncover bottlenecks and prevent supply disruption is to look at connections. Our graph visualization tools reveal connections in data, uncovering patterns and trends and highlighting areas of concern.
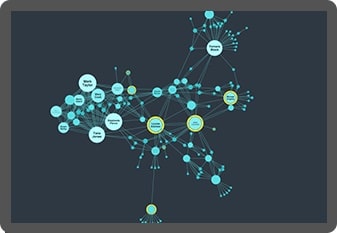
Users interactively explore dense networks of connections, highlighting specific nodes and the components that depend on them.
Comply with changing regulations
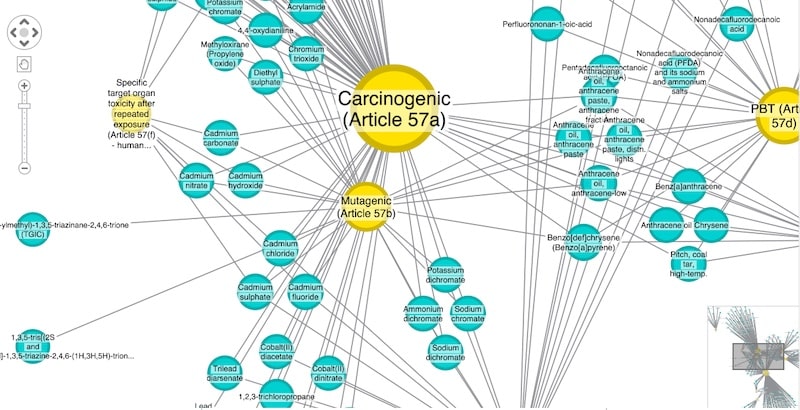
A growing set of regulations impacts almost every supply chain. Designed to improve safety, regulations like the EU’s RoHS rules on hazardous chemicals and the FDA’s UDI mandate on medical devices require clear visibility of the whole supply chain.
The EU’s REACH directive is a great example. It creates legal obligations for companies that produce or supply products containing ‘substances of very high concern’. They need to understand what’s in their products, their supplier’s products, their suppliers’ suppliers products, and so on.
With graph visualization, supply chain managers get a clear view of their full supply chain, and manage tasks like REACH compliance.
Supply chain innovation
As well as improving how things are done now, supply chains help organizations find ways to optimize the future. One example of this is ‘open innovation’ – organizations partnering with businesses in their supply chain to share resources and solve new problems.
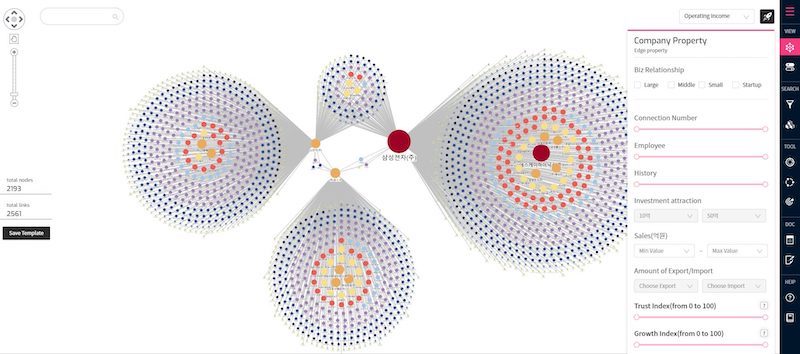
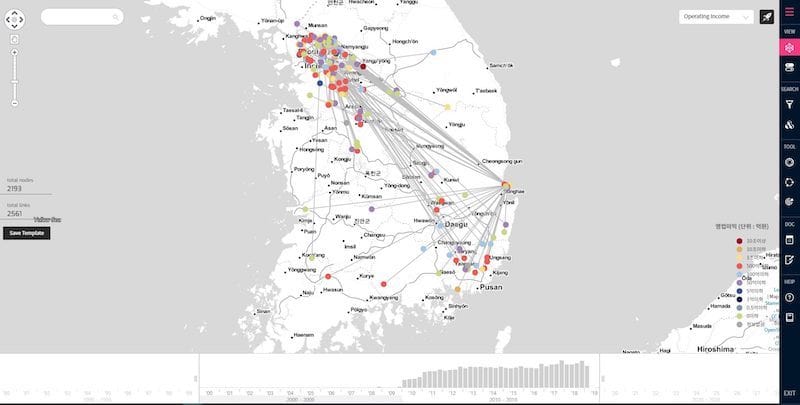
One of our customers, Illunex, used KeyLines, our graph visualization toolkit for JavaScript developers, to build a connected supply chain exploration tool. It allows businesses to explore over 200,000,000 pieces of company data to uncover opportunities for open innovation.
Exploring a database of hundreds of thousands of businesses, using various criteria to find potential supply chain partnerships.
Custom supply chain data visualization tools
We work with businesses, governments and technology vendors worldwide to help them build the tools they need to visualize and manage supply chains.
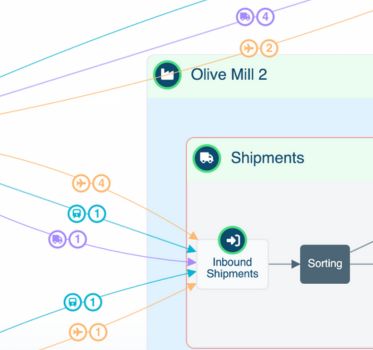
Using our graph visualization and timeline visualization technologies, they’ve built interactive real-time applications that join the dots in complex global supply chains, revealing insight they need to understand.

Overcome data silos
Bring together data from across the organization into a single chart. Our flexible approach means you see the full picture and gain insight from multiple data sources.

An intuitive network view
Discover new dimensions to supply chain data that other kinds of analysis can’t show. Timeline and network visualization reveals network structure and activity in a uniquely intuitive way, leading to faster insight.

Visualization that scales
Our toolkits support visualization at scale. Whether you need to understand specific connections or a vast global network, our products scale to any size organization and supply chain.

A shared view across the business
Data insight is more powerful when it’s shared. Interactive data visualization tools make it easy for every user to access and understand complex data.
