This page is from our blog archive
It’s still useful, but check out visualizing relational databases for more up-to-date info.
We get very excited by new technologies here at Cambridge Intelligence. We are big fans, for example, of graph databases – a class of data store that seems to welcome a new player every few months.
And while many of our customers share our enthusiasm for the new and shiny, they are often restrained by the realities of enterprise IT.
Relational databases have been the workhorse of enterprise data management for decades. Pick any large organization and you can be sure they have years’ worth of data sitting somewhere in a relational database. Migrating that into a graph database, no matter how simple the process, sometimes just isn’t feasible.
It’s understandable then that one of our most frequently asked questions is “Can I run my graph visualization application from a relational database?
Happily the answer is yes.
KeyLines is a toolkit for building graph visualization applications. It is capable of being deployed into pretty much any IT environment, alongside any database – including relational database.
How to visualize graphs with a relational database
Our latest getting started guide takes you through the process of integrating KeyLines with an object-relational database – PostgreSQL.
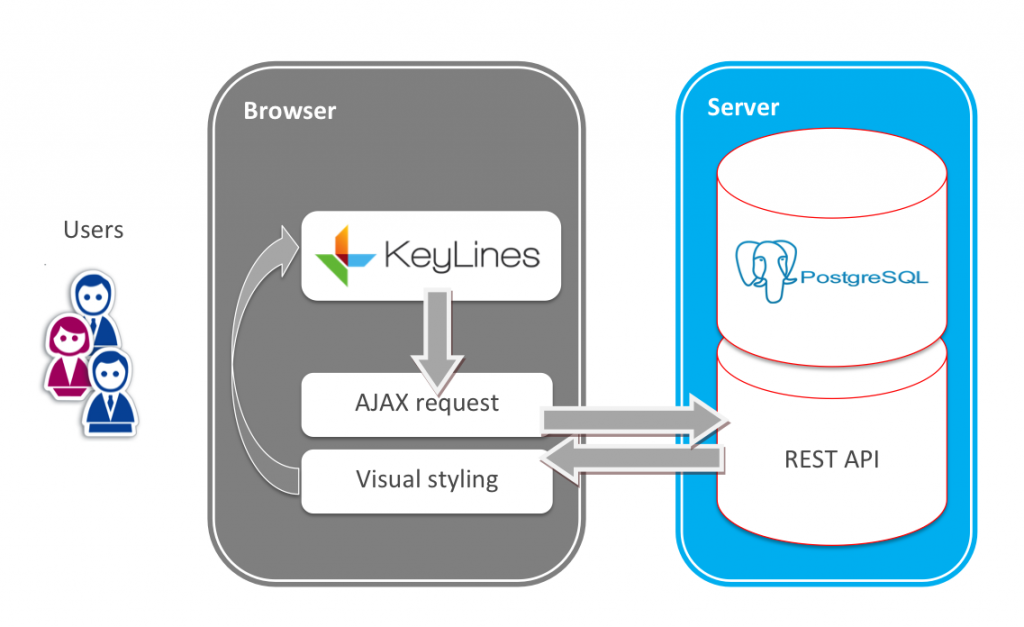
The architecture should be familiar to anyone who has used KeyLines with any other technology with a RESTful API:
- The user interacts with their KeyLines chart, creating events that become Ajax requests.
- A REST API routes these requests to the PostgreSQL server.
- Responses are returned back to KeyLines, again via the REST API, where it is styled and presented back to the user.
Get started!
Once you have decided upon how you intend to map your table to a graph, the integration itself is incredibly simple.
Our guide to visualizing graphs from any source webinar will help you get started.


