An interview with Raymon van der Velde, Co-founder of EclecticIQ
Cyber intelligence data is big, complex and varied. Graph visualization is fast becoming a ‘must-have’ technology tool for organizations serious about cyber threats.
We caught up with Raymon van der Velde, Co-Founder and VP Product at EclecticIQ – an award-winning pioneer of graph-based cyber security tools – to learn more about what they are doing.
Hi Raymon, thanks for joining us! Let’s start with an introduction to EclecticIQ – what is it you do?
Hi Andrew. At EclecticIQ we enable the cyber threat analysts in large organizations to truly harness the power of cyber threat intelligence.
The EclecticIQ platform does that by digesting large amounts of data and presenting it back to the analyst in a way that helps them align their cyber defenses with the threat reality.
That’s an interesting mission. Is the platform for enterprises?
We are working primarily with large, mature organizations with critical infrastructure to protect. So that’s large enterprises – predominantly financial institutions – and governments.
Those kinds of organizations are rapidly developing their threat intelligence practices. Their analysts need to constantly survey the threat landscape and unpick vast amounts of data to see what’s going on. That’s where graph-based solutions are needed most.
We have had interest from other groups as well – especially SOCs (Security Operations Centers), CERTs (Computer Emergency Response Teams) and Fraud and Risk groups – but it’s primarily those large organizations with cyber threat analysts who most urgently need this kind of solution.
There are a lot of cyber start-ups out there. Why is EclecticIQ unique?
We have some great competition out there, there’s no doubt.
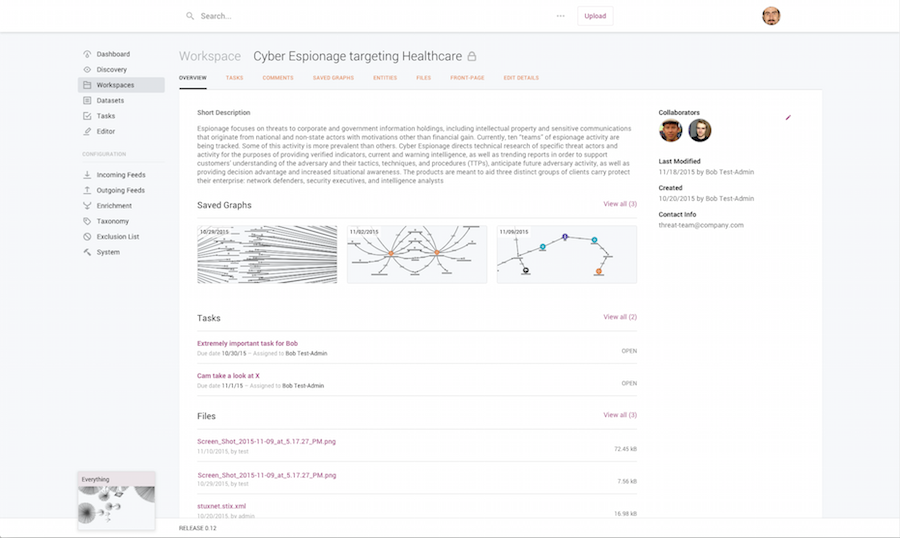
Where most Platforms have a focus on ingestion and sharing, we’ve added an Analytical toolkit, using a graph based approach to exploring and understanding cyber intel data. And because Cyber Threat Intelligence is a capability and not just a tool, we empower the users with Workflow and Process features, making it a true Enterprise Platform.
Presumably that analytical functionality helps analysts to understand and prioritize threats. Is that where KeyLines plays a role?
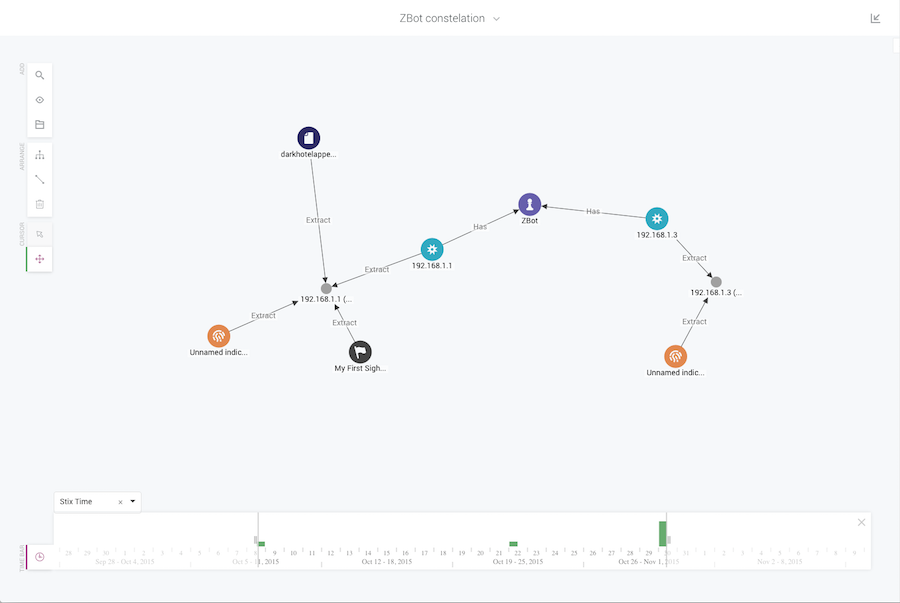
Absolutely. Where KeyLines plays a role for us is in providing a full graph view of the data.
In the past, analysts were not able to have that complete view. They would have different data stores and use really labor-intensive methods to try and correlate it and glean some insight.
It was time-consuming and never gave them the opportunity to explore and expand, which the graph does.
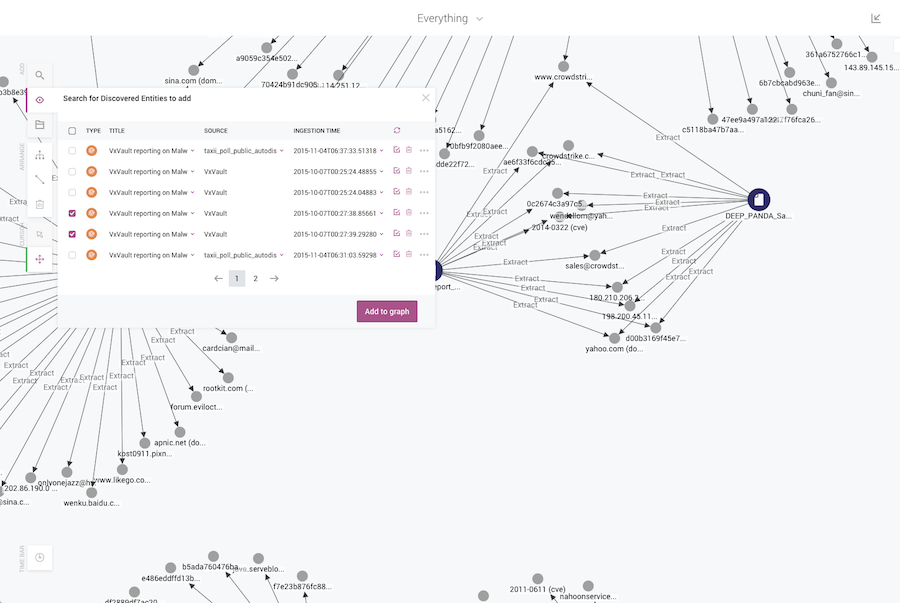
Is that the value the analysts are getting? The ability to join these disparate data sources together, and explore the full graph and find the key insight?
Yes. The advantage of a KeyLines graph is the freedom it provides the user. These cyber analysts are working with the unknowns, and the unknown unknowns.
Only humans are equipped with the analytical and creative skills required to make sense of this information. We can harness the human brain’s pattern recognition capability, but we need to first find a way of interacting with the data.
KeyLines offers that: it gives analysts a way to ‘walk’ the graph. It empowers them to make sense of the data, and it does it in a very efficient way.
Graph visualization is relatively new within threat intelligence, but it is slowly becoming the ‘go to’ tool within the sector as people see its power and value.
You mentioned these analysts are sometimes looking for unknown unknowns. What are the specific challenges of working with cyber threat intelligence data?
You’re right: we’re working with cyber threat intelligence. Of course, it’s a very hot topic with a cool name, but ‘threat intelligence’ means different things to different people.
Cyber threat intelligence can be anything from a list of IP address in an Excel file to a PDF to file hashes, and anything in between.
What ties it all together is that this data is big, complex and varied.
Intelligence is evidence-based knowledge about threats. Our task is to guide the user into taking decisions and taking a response. We need to present them with the intelligence – whether it’s technical information about the tools and technology an adversary uses – or contextual intelligence about an actor’s motivations or different campaigns.
The graph is the ideal way to present information of this scale, complexity and variety in a way that’s easy for a user to manage.
How was your experience with KeyLines?
Whenever you work with a technology, there are two very important aspects: first is the quality of the product, second is the support.
With KeyLines, both of those have been excellent.
The product is superb and our engineers have found the support to be very flexible and responsive. The experience has been top notch.
Yes, I’ve noticed on your website you discuss ‘empowering’ the analysts with the graph. What has the initial user feedback been like?
Everyone we have worked with, both beta customers and our initial customers – have been very positive about the graph. I guess our job now is to build on that success and provide more features within the graph.
I know we are very enthusiastic about the possibilities the graph offers. There’s an urge to start adding on features – well, I think it’s important to guide the users with the right features to help them do their job.
What are your plans for the future?
One thing we are working on currently, soon to go into beta. It will give those analysts insight into how they are managing their threats, but I can’t say too much right now! Your readers will have to follow the EclectiqIQ Twitter account to find out more…


