This page is from our blog archive
It’s still useful, but check out KronoGraph features for more up-to-date info.
Cambridge Intelligence, creators of data visualization technologies that make the world safer, today announced KronoGraph: a new way to build scalable timeline visualizations.
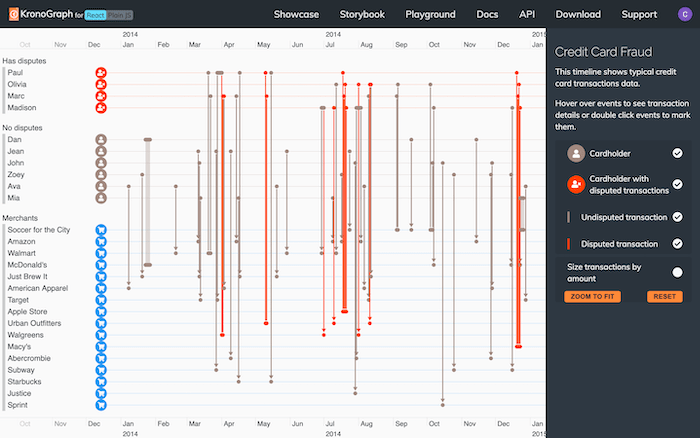
The KronoGraph timeline visualization SDK is the world’s first developer toolkit for building browser-based, interactive, investigative timeline visualizations that reveal how events unfold. It’ll revolutionize the way investigators understand their time-based data in use cases from security to anti-fraud, cyber security to IT infrastructure management and more. Learn more about KronoGraph use cases

Tools built with KronoGraph give users fast, intuitive insight into sequences of events and how they are connected. Users can scroll through time to uncover anomalies and patterns, driving investigations and revealing the hidden story in their data.
Timeline visualizations transition smoothly to look good at any scale – from a single event to a heatmap view of thousands. There are powerful filters for getting rid of clutter, plus useful annotation options for adding context.
The KronoGraph toolkit is for JavaScript and React developers who need to build fully interactive timelines and embed them easily into investigative web applications. It’s entirely customizable and works with any source of time-based data in even your largest datasets. There’s full support for both JavaScript and React throughout the SDK documentation, showcase demos and API library. And while KronoGraph is a standalone tool, it integrates seamlessly with Cambridge Intelligence’s graph visualization toolkits to give users two powerful views of the same data.
Joe Parry, founder and CEO of Cambridge Intelligence said:
KronoGraph gives organizations a brand new way of understanding how events unfold over time. It’s been clear from the very first prototype that a timeline visualization tool was something analysts and investigators need and have been waiting for.
Users can transition smoothly from an aggregated heatmap of thousands of events right down to an individual data point, and the timeline looks beautiful at every stage. We believe it’ll help shape the future of investigative software.


