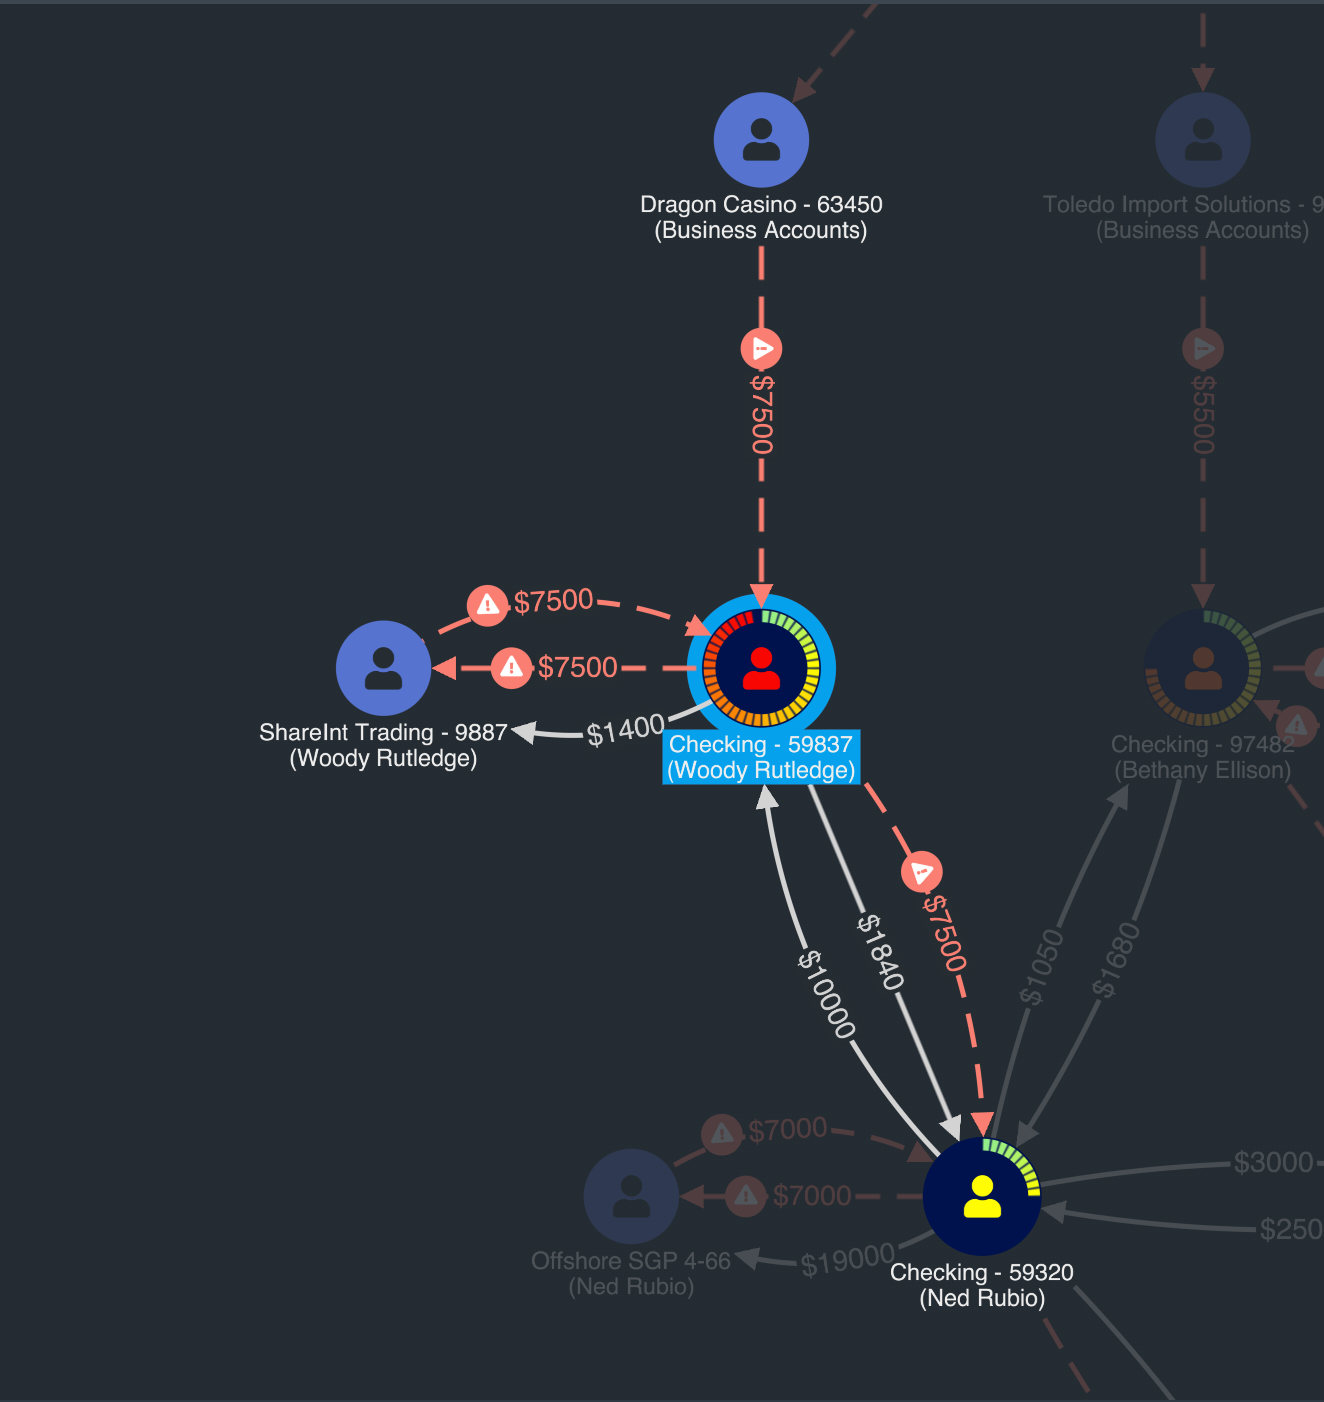
FREE: ReGraph white paper
Our essential guide to building powerful React graph visualization applications.
If you’re looking for a graph visualization toolkit, the first question that may come to mind is whether that toolkit fits with your existing technology stack. React graph visualization libraries have become the go-to choice for developers looking for powerful data visualization with hassle-free integration.
With React’s component-driven approach, you can build dynamic, interactive graphs that fit seamlessly into your existing workflow – no architectural gymnastics required. Here’s why React graph visualization might be your best bet, and which libraries can deliver on that promise.
React graph visualization refers to the use of the React JavaScript library to build interactive, data-driven node-link diagrams. These visualizations allow users to explore and understand complex networks, ranging from connections within OSINT data and cybersecurity asset maps to organizational workflows and customer 360 profiles.
React is particularly well-suited to graph visualization because of its ability to handle dynamic, data-expoloration interfaces. Its component-based structure and support for state management enable developers to build highly interactive visualizations that respond in real time to user actions, streaming data, and complex conditional styling.
Traditional JavaScript graph libraries often require imperative code and direct DOM manipulation. However, React uses a declarative programming model that allows developers to focus on what the UI should look like based on data, and React handles the updates efficiently through its virtual DOM. The result is smoother transitions, a more responsive experience, and a scalable architecture that’s easier to maintain as applications grow.
React graph visualization is already driving mission-critical decision making across a variety of industries, enabling organizations to make sense of complex, interconnected data in ways that traditional tools can’t. By transforming raw datasets into dynamic, interactive graphs, these visualizations reveal hidden patterns, relationships, and risks, all helpful to support faster and better resolutions in high-stakes environments. From cybersecurity and intelligence to financial services and fraud detection, graph-based visual interfaces built with React are becoming essential tools for analysts, investigators, and decision-makers alike.
And while any graph tool can show connections, React-based solutions excel when your users need to drill down, filter dynamically and work with live data streams all without losing their place or breaking their flow.
Cybersecurity teams love React graph visualization because it plugs right into their existing React dashboards without requiring separate tools or context switching. When analyzing device relationships, alert patterns, and network traffic, analysts can build custom filter components, create reusable node styles for different asset types, and sync graph interactions with other dashboard elements. Need to highlight all affected systems when clicking on an alert? React’s state management keeps everything connected. Building drill-down workflows for incident response? Using React components makes it straightforward to create consistent, reusable interfaces that security teams can rely on under pressure.

Investigators deal with messy and constantly changing datasets where the interface needs to adapt quickly as new evidence emerges. React graph visualization handles this beautifully – you can build components that automatically update when new data comes in, create custom node types for different evidence categories, and build filtering interfaces that remember user preferences across sessions.
Whether you’re mapping criminal networks or tracking financial transactions, React’s component reusability means you can create standardized investigation templates while still allowing customization for specific cases. Plus, when you need to present findings to decision-makers, you can embed the same interactive graph components directly into React-based reporting dashboards.
Financial institutions often work with React-based risk management platforms. React graph components can sync with real-time transaction feeds, automatically highlight anomalies based on custom business rules, and provide drill-down capabilities that maintain context across different views.
When building fraud detection workflows, you can create reusable components for common patterns (account clusters, transaction flows, risk indicators) and combine them into larger dashboards. That makes it easy for fraud analysts to interact with live data through familiar React interfaces, while your developers can extend and customize the visualization logic using the same tools they already know.

React graph visualization is increasingly used to show and explain AI decision making. It’s also a great choice for IoT device management, for building interactive network topology views that integrate with device control panels and monitoring systems – all within the same React application your operations teams already use.
Creating interactive node networks with React involves two key considerations.
First, you need to choose the right approach for your project – should you go with an open source library, an off-the-shelf solution, or a comprehensive SDK? We’ll explore some of the best React graph visualization libraries currently available, plus viable alternatives to React-based solutions.
Second, you need to define a data structure of nodes and links, specifying the styling for the items in your graph, and selecting the right layout and interaction models. Doing so will help you create an intuitive model with a UI and UX that serve your users’ specific needs, React makes this whole process smoother by offering reactive data flow, reusable components, and tight integration with state management tools. This not only simplifies building complex, interactive graph visualizations but also ensures performance and scalability in production environments.
If you’re considering building an advanced graph visualization solution, React is a smart choice – especially when paired with specialized tools like ReGraph that are built from the ground up for React environments.
View our tour of ReGraph’s React network visualization API, to better understand how we can help you in creating advanced graph visualizations.
Getting your data structure right from the start will save you a lot of headaches further down the line. React graph tools typically work with JSON schemas where each node needs the attributes: an ID, label, visual styling (colors, icons) and metadata for filtering or grouping behaviors. Your edges should specify source and target nodes, relationship types, and any weight or timestamp data you’ll need.
When you’re dealing with hierarchical data – such as org charts or network infrastructures – you’ve got plenty of options. ReGraph offers combos that let you nest hierarchy levels within parent groups, so users can drill down without drowning in an overload of information.
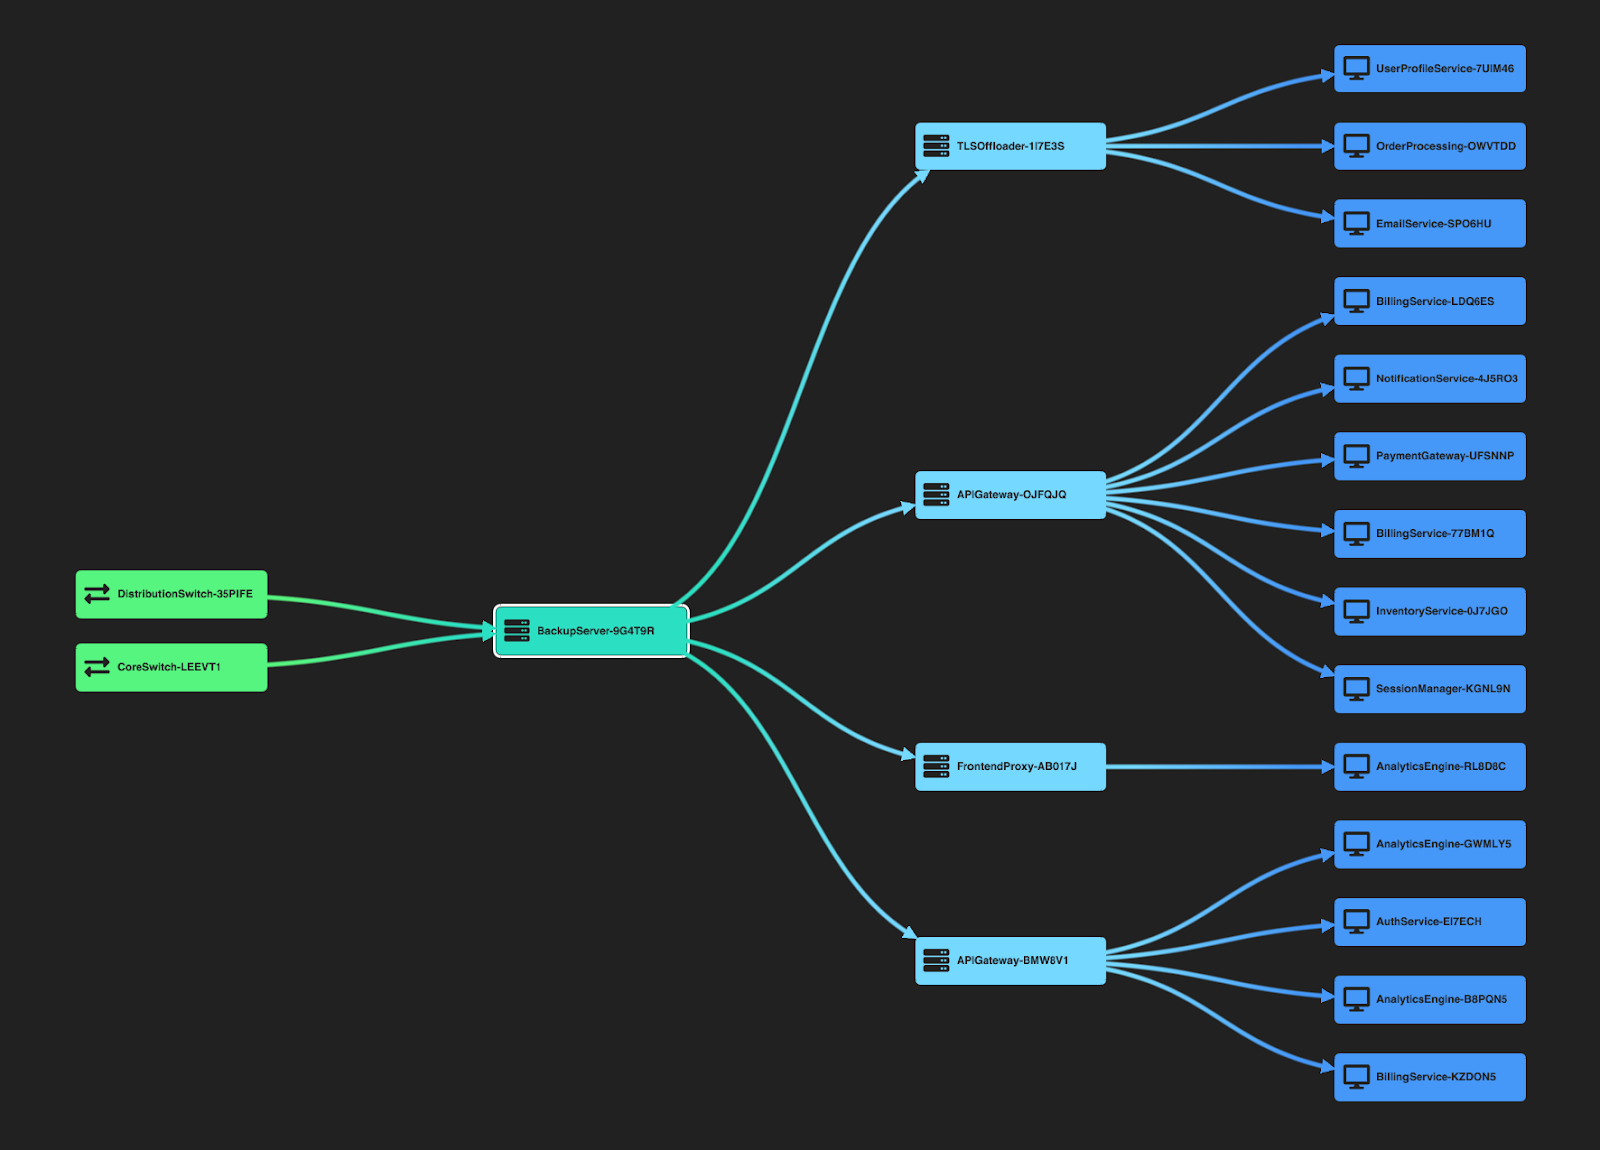
Or you could lay things out sequentially, from top to bottom or left to right. It works really well for highlighting dependencies and flows. In this example, the hierarchical layout shows how an IT infrastructure relies on switches, servers and hosts in a clear visual chain:

If you need both – sequential and hierarchical layout, that’s not a problem – you can combine them. Nested hierarchical flows are perfect for complex scenarios like attack paths through cloud security diagrams:
For real-time data applications, it’s essential to architect for streaming updates. React’s state and effect hooks can manage incoming data feeds, while libraries like ReGraph support dynamic updates that maintain layout continuity and user context.
ReGraph is designed specifically for complex graph data, and it guarantees high-performance, enterprise-grade visualizations. Its declarative API fits naturally into the React paradigm, and it supports advanced features like combined nodes (combos), layouts, filtering, and time-based views.
ReGraph handles large datasets efficiently and offers styling flexibility, making it ideal for security, intelligence, and financial applications.
Cytoscape.js is an open source graph library with the core features you’d expect from a graph visualization library. Combined with a React wrapper, you can use it in React applications. However, integration may require more boilerplate, and performance can vary for large, interactive datasets.
React Flow is great for building node-based UIs and low-code workflows. It’s especially useful for applications like diagram builders, automation workflows, and UI-based logic tools. However, if you’re looking for deep data analytics, it may lack some of the high-performance graph exploration features you need.
While React-based graph visualization is powerful, several alternatives exist both within and outside the JavaScript ecosystem:
KeyLines is Cambridge Intelligence’s JavaScript Graph Visualisation library. It offers all of the same high-performance, enterprise-grade visualizations with an API better suited to traditional imperative JavaScript coding styles.
D3.js offers lots of control and flexibility but has a steep learning curve, limited styling ability for graphs and is more low-level.
Chart.js is better for simpler chart types (bar, pie, line) – we don’t recommend it for complex graphs.
Neo4j Bloom is a tool for visualizing data in Neo4j graph databases, offering query-based exploration. It’s limited to the Neo4j ecosystem.
Gephi is a desktop tool used for static graph analysis and exploration. It’s not suited for web apps or real-time data.
Ultimately, the right choice depends on your development stack, visualization goals, and the level of interaction required.
Ready to explore your data through powerful and interactive visualizations? Our advanced React-based graph visualization toolkit is built for performance, flexibility, and usability. Whether you’re mapping cyber threats, investigating fraud, or building knowledge graphs, ReGraph offers everything you need, from smooth layouts to dynamic data streaming and advanced styling.