A graph of top contributors of popular front-end and full-stack frameworks on GitHub.
In this tutorial, we’ll build a React application that explores GitHub contributors, revealing who contributes to popular frameworks and also how those developers are connected across the ecosystem.
We’ll use TanStack Start to fetch and structure data from the GitHub API, and ReGraph to visualize relationships between contributors. By the end, we’ll have an interactive network you can explore to see how developers collaborate across projects.
TanStack Start is a full-stack React web framework built on TanStack Router and Vite. It gives you flexibility in how your app renders, supporting SSR, streaming and type-safe validation of server functions. That flexibility is useful when working with visualization libraries like ReGraph, which rely on the client for rendering and interaction.
What we’ll be doing in the tutorial
Following this tutorial you will:
- Fetch contributor data from the GitHub API
- Transform that data into a graph structure
- Visualize relationships between contributors using ReGraph
To get started with ReGraph, you can request a trial and get on your way to exploring how graph visualization can help uncover interesting connections. I’ll be using VSCode as my editor on MacOS.
As we’ll be using the GitHub public API, be mindful of its rate limits and if you want, you can use an authentication token to increase those.
Step 1 – setting up our TanStack application
We’ll start by scaffolding our application and the quickest way to do this is by using one of TanStack’s many templates. We’ll pick start-counter as it provides all the basics we’ll need without any unnecessary extras – a TypeScript React application with a basic routing and component set up. Alternatively, you can also follow TanStack’s Build from Scratch guide.
First we’ll run gitpick to copy the content of a template in a new repository:
npx gitpick TanStack/router/tree/main/examples/react/start-counter tanstack-and-regraph
Then we can go into the new repository folder:
cd tanstack-and-regraph
Then we add ReGraph as a dependency. You can grab the ReGraph bundle file from the ‘Downloads’ page of the SDK site, once you’ve started your trial.
We copy it from the downloads folder to our repository’s root directory and install it with our desired package manager. We also install the rest of the dependencies that are required by TanStack Start for our project.
cp ~/Downloads/regraph-x.x.x.tgz .
npm add file:regraph-x.x.x.tgz
npm install
Step 2 – integrate ReGraph with TanStack Start
Next, let’s clean up our app and get it ready to integrate with ReGraph. We can create a global CSS file to reset the default margin on our page and size our chart element. In the src folder, create a new file called global.css and write the following:
CSS
body {
  margin: 0;
}

.chart {
  height: 100vh;
  width: 100%;
}
Import the CSS file at the top of __root.tsx, which is our main entry point for the app and found under src/routes:
JavaScript
import "../global.css"
Then, create a global.d.ts file in the /src directory, so TypeScript doesn’t complain about the global CSS import that we just performed.
TypeScript
declare module "*.css" {}
Finally, let’s adjust index.tsx in the routes directory and add ReGraph:
TypeScript
import { createFileRoute } from "@tanstack/react-router";
import { createServerFn } from "@tanstack/react-start";
import { Chart } from "regraph";

export const Route = createFileRoute("/")({
  component: Home,
});

function Home() {
  return (
    <div className="chart">
      <Chart items={{ node: { label: [{ text: "Hello world!" }], color: "#1e8ba4" } }} />
    </div>
  );
}
At the top, we import createFileRoute to create our Home route /, as well as createServerFn, which we’ll use later on. Finally, we import the React Chart visualization component so we can use it in our app. We also add the chart CSS class, which we defined earlier, to span the visualization across the whole screen and a single node to confirm that our app is running well.

At this point, if we run npm run dev in our terminal, we can see our application running at http://localhost:3000/ and that ReGraph is visualizing our test data! We might think that’s that and we can move on, but there’s a catch. Opening our developer console reveals an error: window is not defined.

It shows that there was an error rendering our application on the server and instead it was rendered on the client side. This will be true if you use any client-side library that needs to access specific APIs from the browser to operate and it’s true especially for visualization libraries such as ReGraph.
Fortunately, TanStack is built with flexibility in mind to support many different ways of delivering applications to the end user. Let’s explore this next.
Step 3 – selective SSR rendering and running our application for the first time
One of TanStack Start’s features is its isomorphic design, where the application’s code runs both on the server and client side. This gives us an array of tools that let us create applications that run fully on the server side, classic Single Page Applications, or best of all, a mix of both.
In our case, ReGraph itself is a client-side library that relies on specific browser APIs to operate. This means we want ReGraph to run only on the client side and TanStack Start makes this a breeze. We’ll use its selective SSR rendering to achieve this and ultimately get rid of the error we are seeing in the console.
Switching rendering modes
It’s as easy as adding ssr: false to our route, which will only disable server rendering for this specific route. This would be very useful if you still want to have other parts of the application make use of server rendering for things like SEO optimization. Even better, we can switch to a hybrid mode with ssr: “data-only” that will let us use the Route’s lifecycle hooks beforeLoad and loader to fetch data from GitHub’s API, but only render the Route’s component on the client side. This is perfect for us, so let’s do it.
We’ll update our route in index.tsx to enable data-only SSR:
TypeScript
export const Route = createFileRoute("/")({
  ssr: "data-only",
  component: Home,
});
If we go to our application and refresh the browser, we should see no errors in the developer console. This confirms that our Home component only gets rendered on the client side.
Before we move on, we can explore the flexibility of TanStack Start’s isomorphic design and see what other ways you can load client-side libraries; or you can skip straight to the next step.
Alternatives
If you want to keep full SSR enabled on all of your routes, but still use a client-side library, then you can dynamically import those libraries. This is something other server-first SSR frameworks let you do – such as Next.js and its dynamic import function.
If we were to do it in TanStack Start, it would look something like this:
TypeScript
import { createFileRoute } from "@tanstack/react-router";
import { useEffect, useState } from "react";

type RegraphModule = typeof import("regraph");

export const Route = createFileRoute("/")({
  ssr: true,
  component: Home,
});

function Home() {
  const [regraph, setRegraph] = useState(null);
  const Chart = regraph?.Chart;

  useEffect(() => {
    let active = true;

    import("regraph").then((module) => {
      if (active) {
        setRegraph(module);
      }
    });

    return () => {
      active = false;
    };
  }, []);

  return (
    <div className="chart">
      {Chart && (
        <Chart
          items={{
            node: { label: [{ text: "Hello world!" }], color: "#1e8ba4" },
          }}
        />
      )}
    </div>
  );
}
Another alternative is the option of wholesale disabling server rendering using SPA Mode. This might be useful in situations where SEO is not a big concern, such as with internal company applications. This can be done easily by adjusting the Vite configuration file vite.config.ts so it looks something like this:
export default defineConfig({
  plugins: [
    tanstackStart({
      spa: {
        enabled: true,
      },
    }),
  ],
})
Step 4 – using server functions to fetch GitHub contributor data
Let’s move onto the exciting part of fetching our data from GitHub and preparing it to show in our visualization. We’ll use two main features of TanStack here: server functions and the route’s loader property.
First, let’s set up some infrastructure so we can safely fetch data from GitHub. We’ll have two global variables: the base URL to the API and another with all the repositories for which we want to fetch the top contributors. We’ll create a TypeScript interface for the API’s response properties that we will use in our application. Finally, we’ll need to transform the returned data from the API to nodes and links that ReGraph will recognize and visualize.
Back in our index.tsx file we’ll add those under the import statements:
TypeScript
const API_BASE_URL = "https://api.github.com";
const TRACKED_REPOS = [
  { owner: "facebook", repo: "react" },
  { owner: "vercel", repo: "next.js" },
  { owner: "TanStack", repo: "query" },
  { owner: "vuejs", repo: "core" },
  { owner: "angular", repo: "angular" },
  { owner: "sveltejs", repo: "svelte" },
  { owner: "vitejs", repo: "vite" },
  { owner: "remix-run", repo: "remix" },
];

interface GitHubContributor {
  login: string;
  contributions: number;
  avatar_url: string;
}

// Convert GitHub repo contributors to nodes and links in the format expected by the Chart component
function repoContributorsToItems(
  currentItems: Items = {},
  repoName: string,
  contributors: GitHubContributor[],
): Items {
  const newItems: Items = { ...currentItems };

  newItems[repoName] = {
    color: "rgb(238, 100, 32)",
  };

  contributors.forEach((contributor: GitHubContributor) => {
    newItems[contributor.login] = {};

    newItems[`${repoName}-${contributor.login}`] = {
      id1: repoName,
      id2: contributor.login,
    };
  });

  return newItems;
}
The repoContributorsToItems function takes a list of top contributors and the repository they belong to and creates nodes for all of them. Then it creates links between the repository node and each contributor. As to not run into any GitHub API rate limits, you can comment out all tracked repositories except React and Next.js.
Next, we’ll create a server function that will do the actual fetching of the data. It goes at the top level of the document, with the rest of the items we already added in this step:
TypeScript
const fetchRepoContributors = createServerFn()
  .inputValidator((data: { owner: string; repo: string }) => data)
  .handler(async ({ data }): Promise<githubcontributor[]> => {
    const response = await fetch(
      `${API_BASE_URL}/repos/${data.owner}/${data.repo}/contributors?per_page=40`,
    );

    if (!response.ok) {
      throw new Error(`GitHub API request failed: ${response.statusText}`);
    }

    return response.json();
  });
</githubcontributor[]>
The great thing about server functions is that they can be called by either the server or client-side of the application, but will only run on the server. Alongside their inputValidator method, they provide end-to-end type safety.
We’ll continue by staying inside index.tsx and update our route:
TypeScript
export const Route = createFileRoute("/")({
  ssr: "data-only",
  component: Home,
  loader: async () => {
    try {
      let initialData: Items = {};

      // Fetch top contributors for tracked repos
      for (const { owner, repo } of TRACKED_REPOS) {
        const contributors: GitHubContributor[] = await fetchRepoContributors({
          data: { owner, repo },
        });

        initialData = repoContributorsToItems(initialData, repo, contributors);
      }

      return initialData;
    } catch (error) {
      console.error("Error fetching GitHub data:", error);
    }
  },
});
We’ve added an asynchronous function to the loader property of the route. The loader will be executed before the UI is painted, so we’ll have all of our data fetched and transformed into ReGraph items. The data will be immediately available to the Home component. This is another great feature of TanStack that, again, guarantees type safety. When we fetch this initial data in our component, it will already be correctly typed.
Finally, we’ll update our React Home component:
TypeScript
function Home() {
  const initialData = Route.useLoaderData();

  return (
    <div className="chart">
      <Chart items={initialData} />
    </div>
  );
}
We use the route’s useLoaderData method to fetch the data from the loader. As it’s fully available to the component and its TypeScript type is Items, we can ingest it straight into our ReGraph chart.
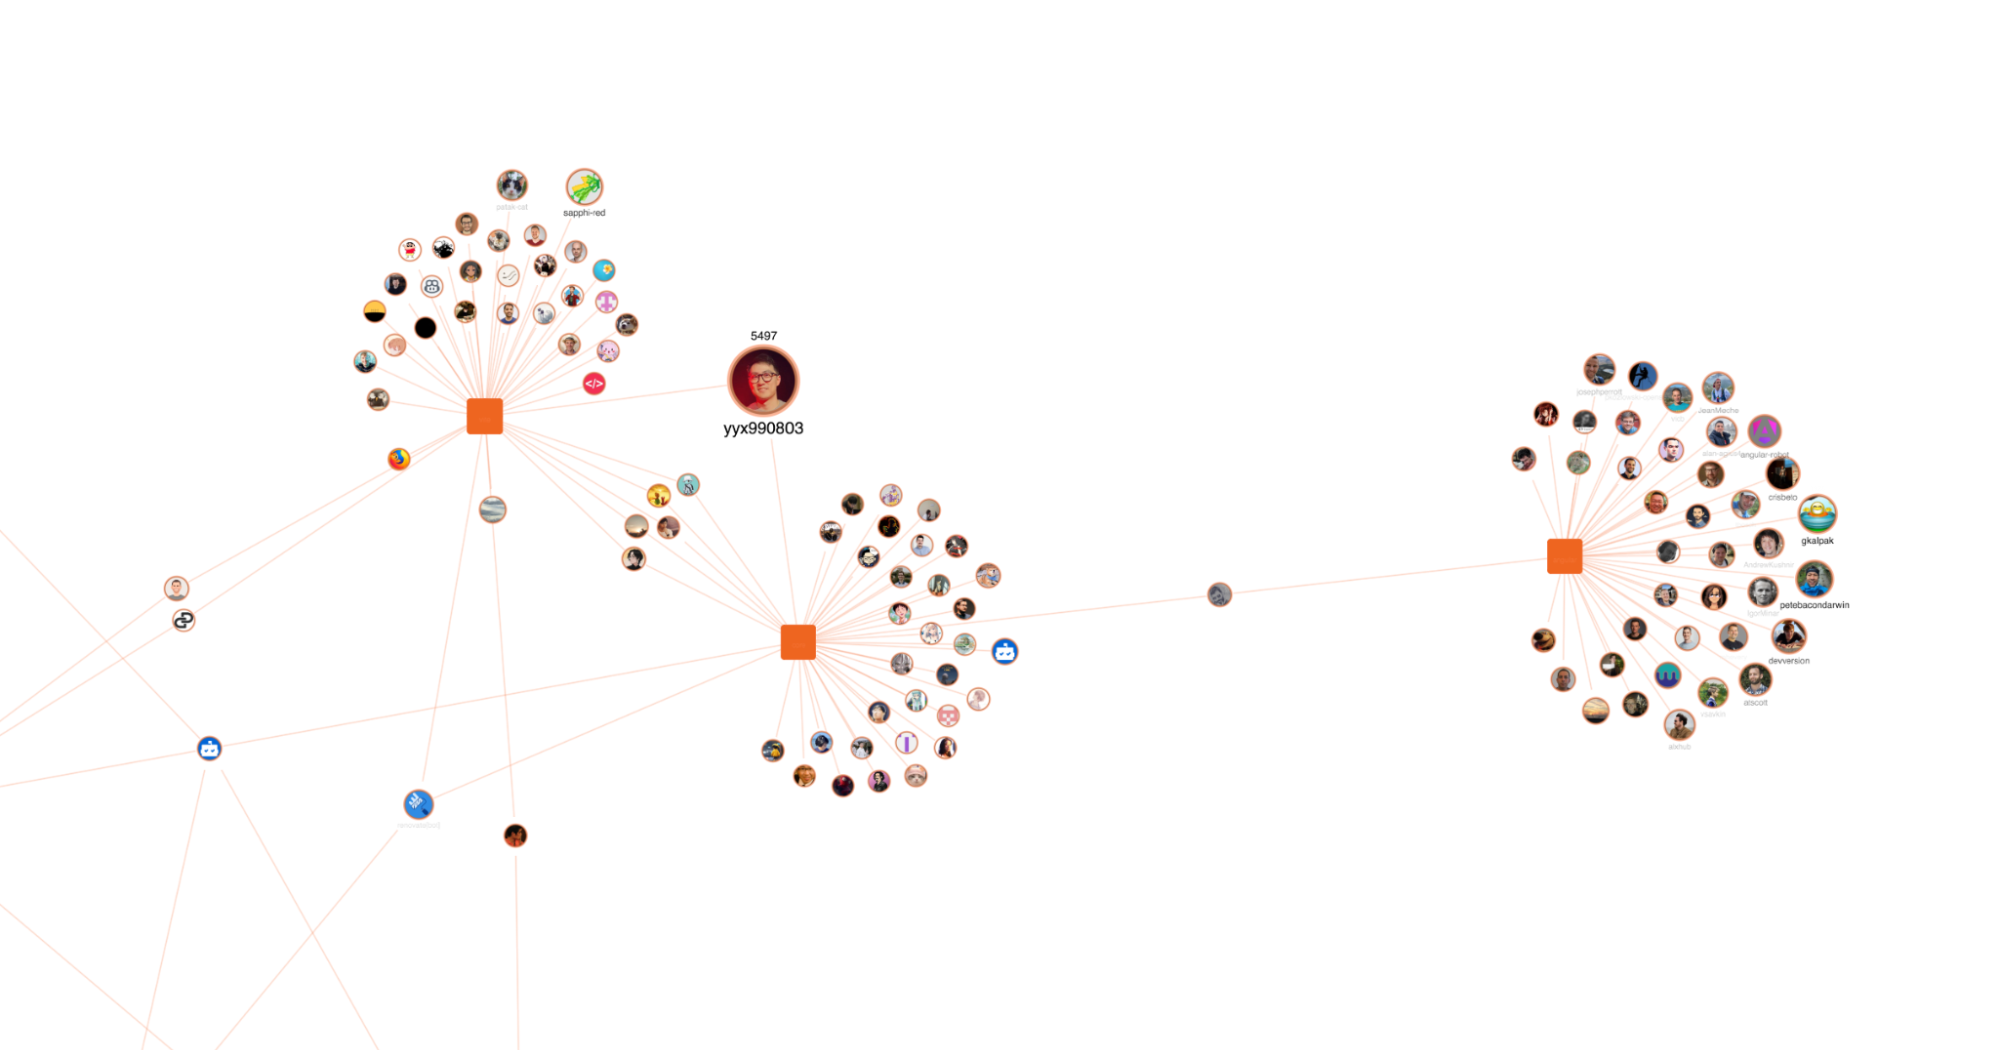
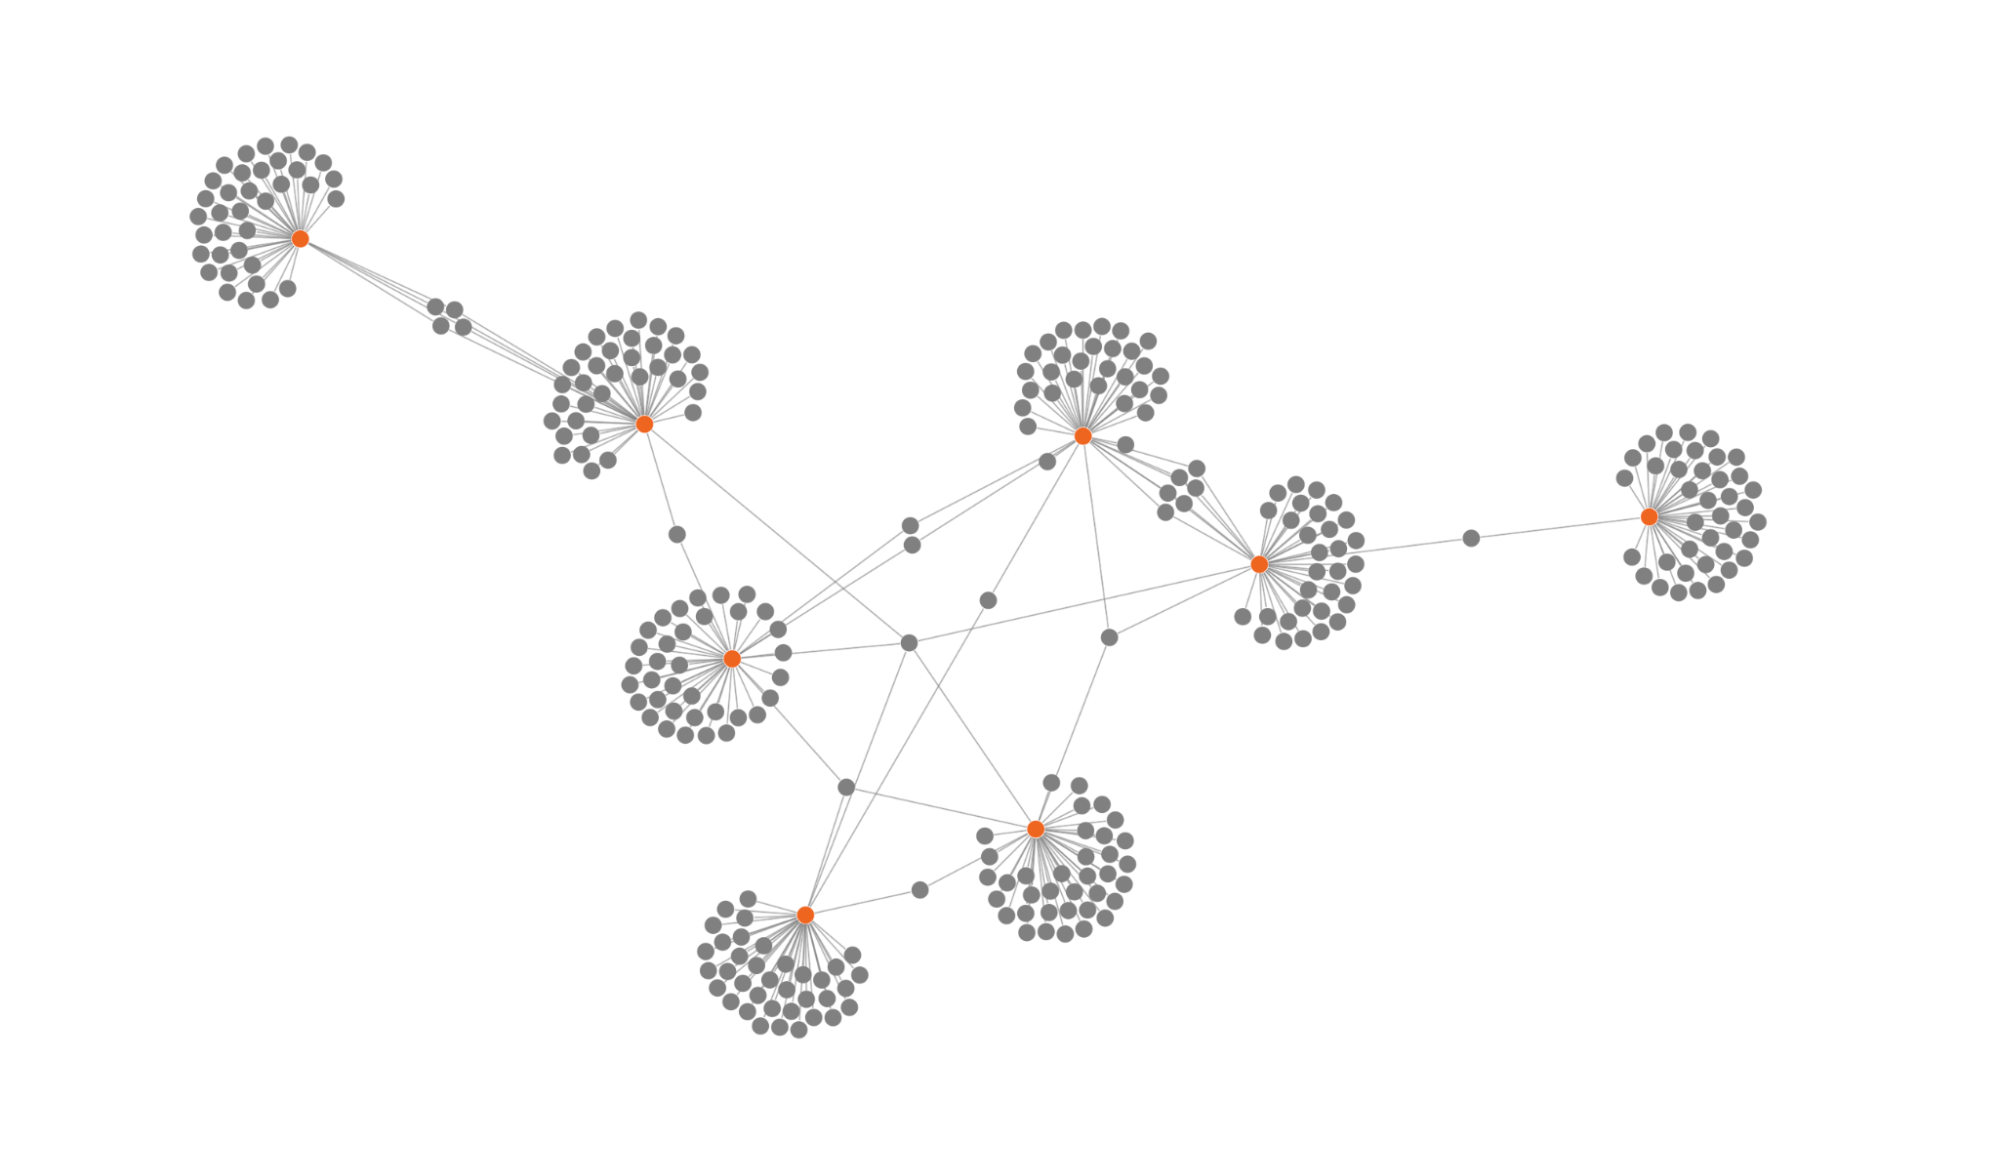
We now have the top contributors of influential front-end frameworks and we can already start to see connections between those, but we can take this further!
Step 5 – visualising our data with ReGraph
Our visualization has been scaffolded and it’s taking shape, but to truly make it stand out and produce impactful visuals, we can adjust the styling to help us highlight the story we’re trying to tell.
The first step is to update our repoContributorsToItems function, which takes care of the item creation:
TypeScript
function repoContributorsToItems(
  currentItems: Items = {},
  repoName: string,
  contributors: GitHubContributor[],
): Items {
  const newItems: Items = { ...currentItems };

  newItems[repoName] = {
    color: "rgb(238, 100, 32)",
    label: [
      {
        text: TRACKED_REPOS.find(({ repo }) => repo === repoName)?.owner,
        backgroundColor: "transparent",
        color: "white",
        fontSize: 12,
        padding: [5, 15],
        position: { vertical: 20 },
      },
      {
        text: repoName,
        backgroundColor: "transparent",
        color: "white",
        fontSize: 18,
      },
    ],
    border: { radius: 10 },
    shape: { height: 90, width: 90 },
  };

  contributors.forEach((contributor: GitHubContributor) => {
    // Create a contributor node if it doesn't exist, or update the contributions count if it does
    if (!newItems[contributor.login]) {
      newItems[contributor.login] = {
        border: { color: "rgba(238, 100, 32, 0.5)", width: 4.5 },
        label: [
          { text: contributor.login, position: "s" },
          { text: `${contributor.contributions}`, position: "n", fontSize: 10 },
        ],
        image: contributor.avatar_url,
        cutout: true,
        size: 1,
      };
    } else {
      const existingLabel = newItems[contributor.login].label;
      if (Array.isArray(existingLabel) && existingLabel[1]) {
        existingLabel[1].text = `${Number(existingLabel[1].text) + contributor.contributions}`;
      }
    }

    // Create a link between the repo and the contributor
    newItems[`${repoName}-${contributor.login}`] = {
      id1: repoName,
      id2: contributor.login,
      width: 3,
      color: "rgba(238, 100, 32, 0.35)",
    };
  });

  return newItems;
}
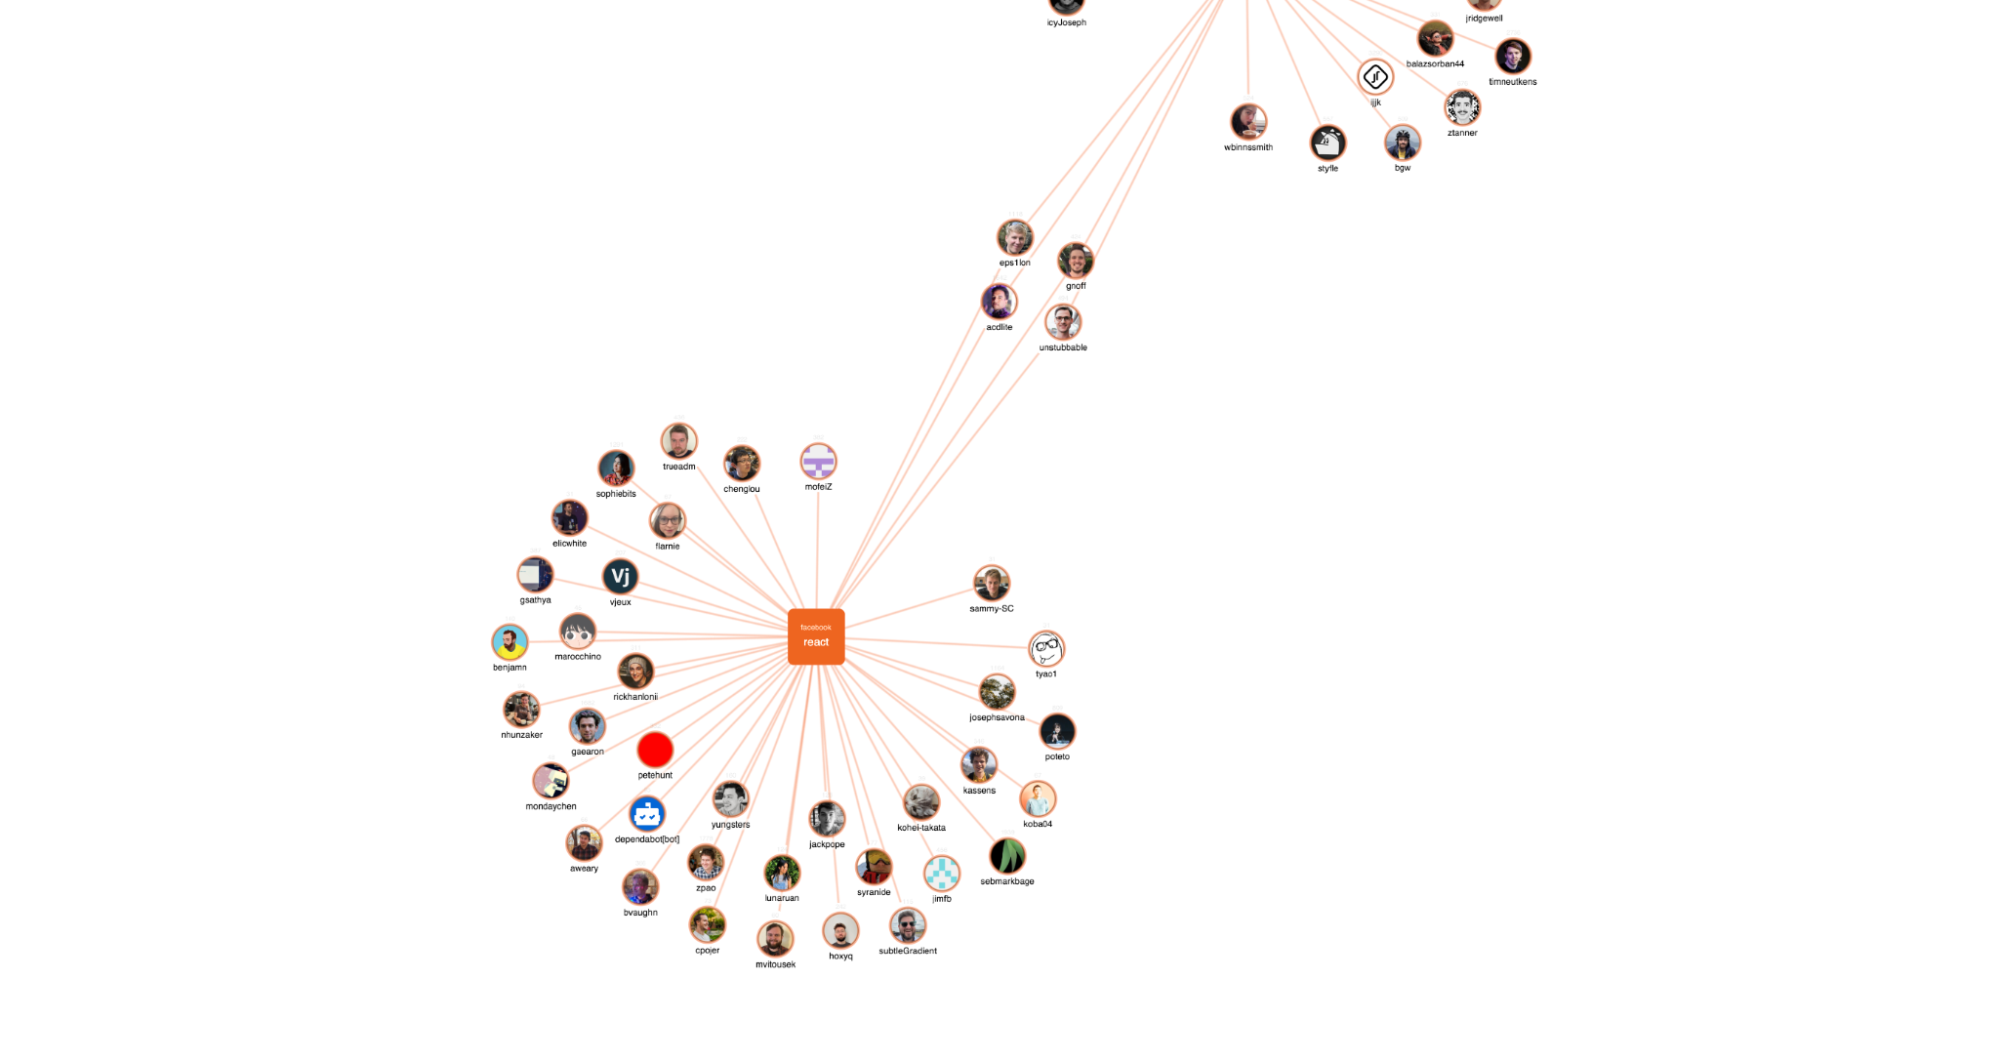
What we’ve done here is assign appropriate colors to the repository nodes, added images to the contributor nodes and made our links work with the general color scheme. Additionally, we made sure to sum up the total contributions for individuals who span multiple repositories.
Now we can see some interesting connections between repository contributors, but we can make that even clearer.
Let’s size items based on each individual’s total contributions. Link width will represent the number of contributions to each repository and node size will represent total contributions across all repositories.
Let’s create a new function at the top level, above or below repoContributorsToItems:
TypeScript
function sizeItemsBasedOnContributions(items: Items): Items {
  const sizedItems: Items = { ...items };
  const contributionCounts: Map<string, number=""> = new Map();

  for (const [id, item] of Object.entries(sizedItems)) {
    if ("id1" in item) continue; // skip links
    const label = item.label;
    if (Array.isArray(label) && label[1]) {
      contributionCounts.set(id, Number(label[1].text) || 0);
    }
  }

  if (contributionCounts.size === 0) return sizedItems;

  const counts = [...contributionCounts.values()];
  const max = Math.max(...counts);
  const min = Math.min(...counts);
  const range = max - min || 1;

  // Size contributor nodes
  for (const [id, count] of contributionCounts) {
    const normalized = (count - min) / range;
    const item = sizedItems[id];

    if ("size" in item) {
      item.size = 1 + normalized * 2;
    }
  }

  // Size links based on the contributor node's total contributions
  for (const [, item] of Object.entries(sizedItems)) {
    if (!("id1" in item)) continue;

    const contributorId = contributionCounts.has(item.id1) ? item.id1 : item.id2;
    const totalContributions = contributionCounts.get(contributorId);
    if (totalContributions === undefined) continue;

    const normalized = (totalContributions - min) / range;
    item.width = 1 + normalized * 7;
  }

  return sizedItems;
}
</string,>
Now adjust the Route’s loader function to return the initial items sized with our new function:
TypeScript
return sizeItemsBasedOnContributions(initialData);
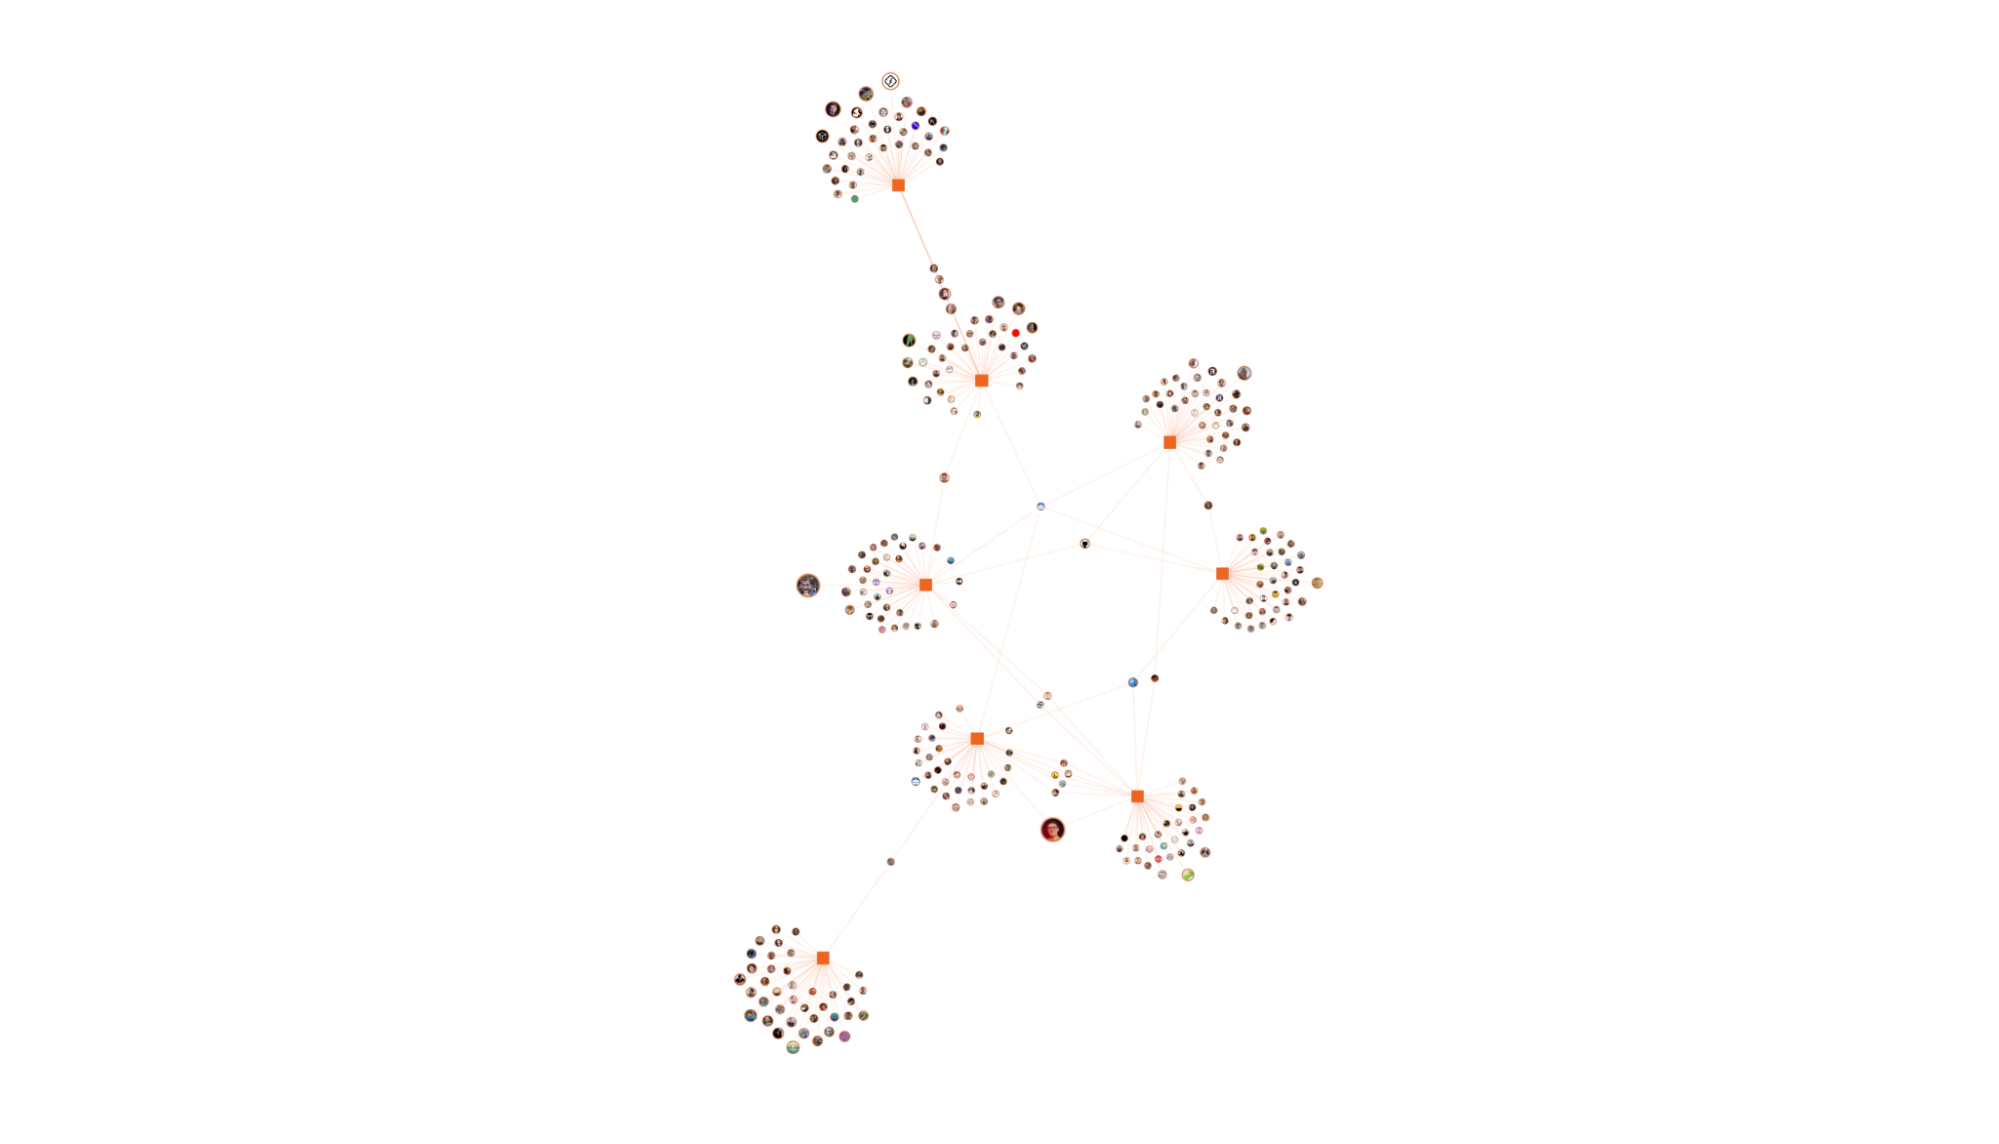
Our chart is complete! We can dive in and see what interesting connections we can find thanks to all our hard work so far.
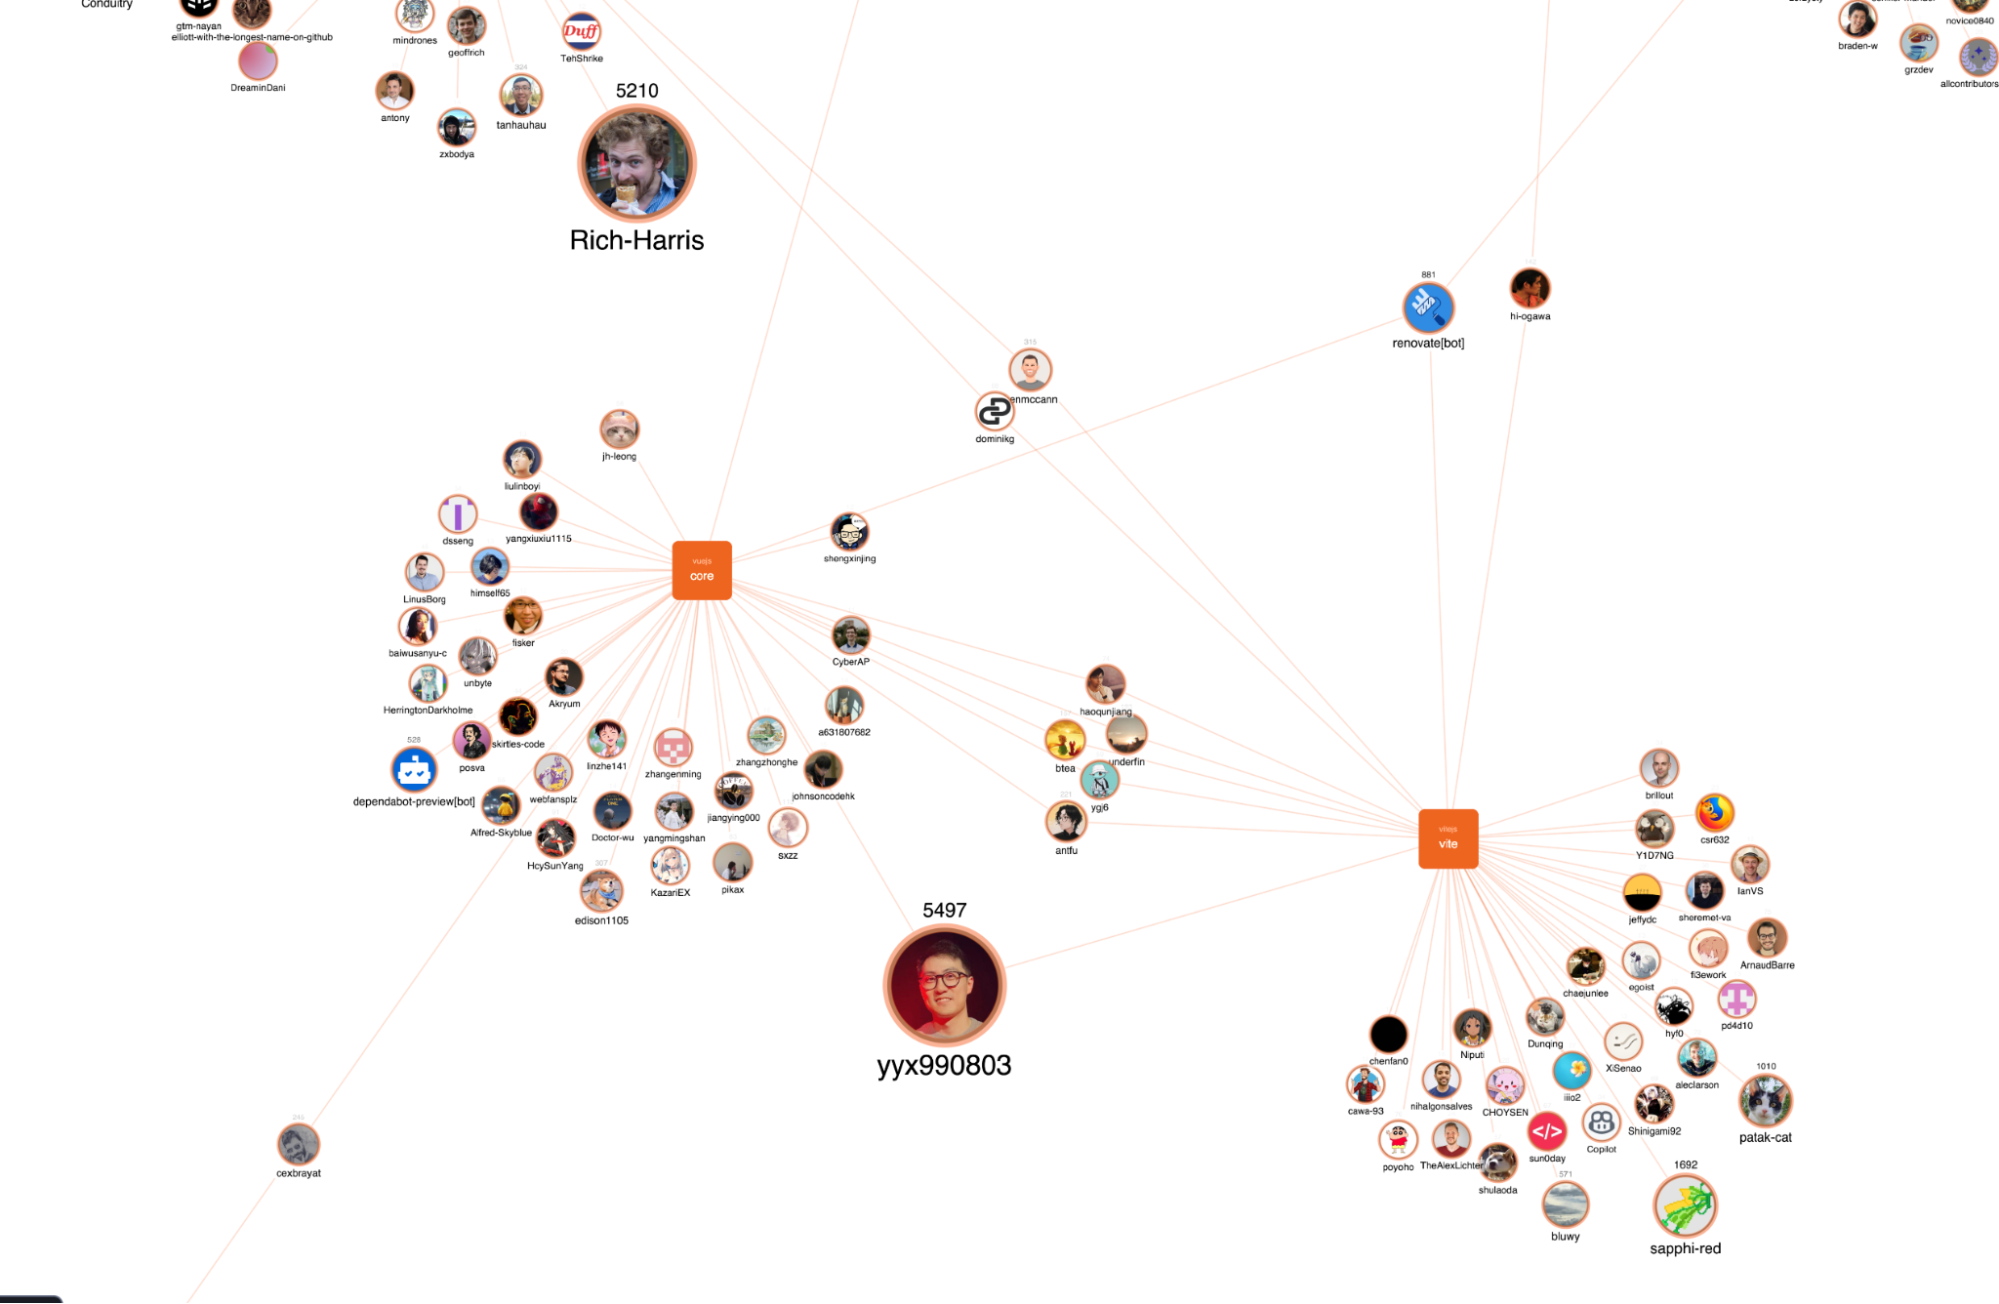
First, we can see that Next.js and Angular sit in their top-left and bottom-left corners, respectively. Some top contributors from React also contribute to Next, and Angular sits even more on its own with only one contributor shared between itself and Vue.js.

Unsurprisingly, Vite and Vue.js contributions are dominated by their legendary author Evan You, alongside many other shared contributors. Finally, we can see that Evan and Rich Harris, creator of Svelte, sit at the top in this dataset based on the total number of contributions across all repositories.
Go further with ReGraph and TanStack Start
You now have a working application that visualizes relationships between GitHub contributors and helps you explore how developers connect across projects in the ecosystem.
TanStack Start can carry the heavy weight of complex web applications thanks to its many features that help developers granularly control the execution of their apps.
Likewise, ReGraph can quickly bring data to life and let us investigate the intricacies of how people connect through their work and love for the web and its developer ecosystem. The same approach can be extended to real-world applications to give users more context and control when exploring complex data.
We barely brushed the surface of ReGraph’s features. You can extend this further with larger datasets, custom layouts and richer interactions. Its ease of use in development speeds up visualizing your data and the same is true for the full suite of toolkits from Cambridge Intelligence. They make use of, and integrate well with, the latest technologies in web development.
If you want to explore further, request a trial to experiment with the ReGraph Playground to build and test visualizations directly in your browser.
Share: