FREE: Start your trial today
Visualize your data! Request full access to our SDKs, demos and live-coding playgrounds.
Brilliant business strategies come from understanding complexity. Businesses that can cut through noise, spot connections and make decisions based on real data insights are more likely to succeed.
In this blog post, we’ll take a look at Traversals’ SaaS Intelligence Platform and how it uses graph technologies, including the ReGraph toolkit, to help businesses make intelligence-driven decisions. We’ll also use their platform to explore the autonomous vehicle market in China.
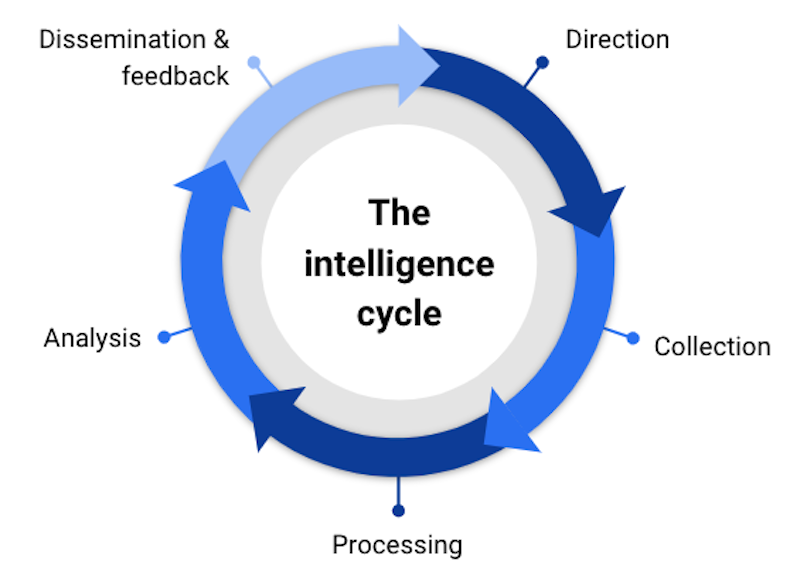
Governments have long understood the need for intelligence-backed decisions. They invest billions of dollars in research and analysis, collecting, processing and connecting data on a massive scale, informing policy and making tactical decisions. There’s even a standardized process – the intelligence cycle – to guide the route between asking a question and answering it.
It was while building tools for the intelligence and law enforcement communities that the founders of Traversals saw the potential to apply them to the private sector. What if businesses could enjoy the same powerful data search and analysis capability as the police or governments?
The result is Traversals’ Intelligence Platform. It combines federated search, data fusion, translation, and natural language processing to produce custom knowledge graphs covering any topic, for any audience, on-demand. All presented with an interactive ReGraph graph visualization component.
It empowers businesses to ask complex and nuanced questions, scour the open and dark web for relevant information, and follow the intelligence cycle in an agile way to refine it into decision-making insights.
Let’s take a look at an example.
Before we dive into the Traversals Intelligence Platform, we should define the intelligence cycle.
It’s a 5-stage loop, widely used in government and law enforcement circles, to answer complex questions quickly and methodically.
The autonomous vehicle (AV) market is an area of rapid innovation. Each car manufacturer wants to gain an advantage. To do that, they need to answer a lot of questions, about competitors and products, customers and markets.
China is a particular hotbed of activity. The Chinese car market is already the world’s largest, and the Chinese government has committed to intelligent, and autonomous, vehicles in a number of their ‘five-year plans’ – adapting their regulations accordingly. Deloitte believes the autonomous vehicle market there will be worth $2.3bn USD by 2030.
As a result, R&D cash for AV projects has flowed into China. Businesses worldwide use the country as a testing ground for self-driving cargo trucks, robotaxis, and driverless cars.
The world’s car manufacturers are watching, so let’s put ourselves in their position. Let’s see how we could use the Traversals Intelligence Platform, and graph visualizations powered by ReGraph, to monitor the Chinese autonomous vehicle (AV) market.
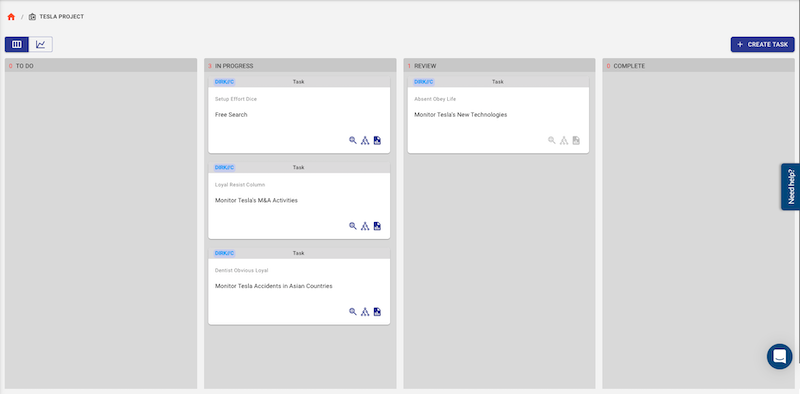
First, we’ll need to ask a question. This could be something fairly specific, like “how common are accidents involving WeRide robotaxi vehicles in China?”, or we could monitor broader topics, like the AV market generally or the activity of key players.
The analyst just needs to define a set of semantic, geographic, or text-based queries within the platform.
Based on the queries defined in our tasks, the platform starts a federated search call, scouring the surface and deep web for relevant data. Smart AI algorithms optimize, translate and extend the queries too, meaning a single search returns relevant related results from over 140 languages.
Once the federated search is complete, a range of algorithms and processes add context and clarity:
All of this happens before the analyst even sees the results of their query.
This is where, for us graph visualization practitioners, things start to get really exciting. The power of federated search, AI, NLP, a graph database – and plenty of other clever back-end technologies – leaves us with a custom knowledge graph dataset, ready to explore.
Knowledge graphs are tools to understand related knowledge and information. Visualizing them is a great way to quickly and intuitively get a clear insight into complex situations.
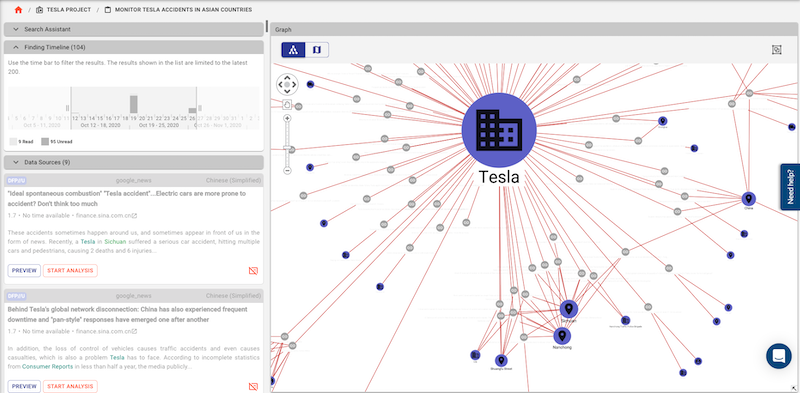
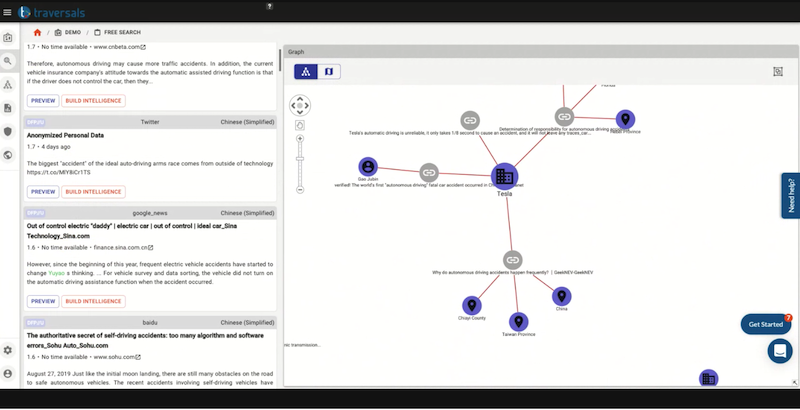
Here’s our knowledge graph for the query ‘autonomous vehicles accident’:
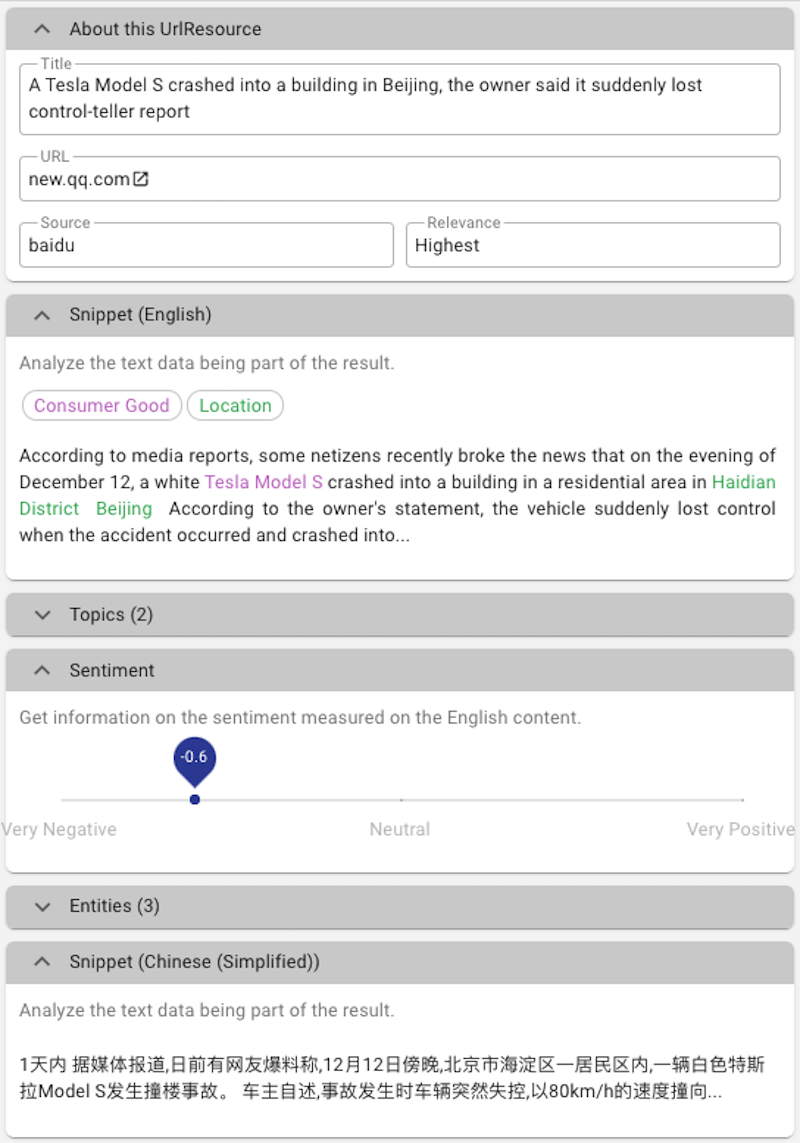
The platform displays results on the left-hand side of the display, translated from Mandarin and ordered by relevance. The NLP algorithm has identified entities in the data and semantically linked them ready for visualization.
Analysts then navigate the results using the list, or the interactive ReGraph graph visualization component on the right-hand side. The Traversals team makes good use of font icons to highlight different entities in the graph – in this case, business, locations, people and article URLs.
The interactions are bidirectional too – as an analyst selects a node, the relevant search result is highlighted, and vice versa.
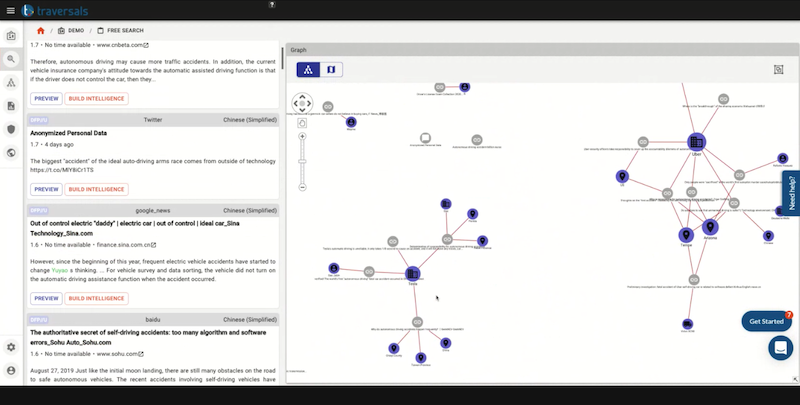
The Traversals team harnesses ReGraph’s automated layouts to position the nodes across the chart, clearly showing clusters of connected results. ReGraph’s degree centrality measure sizes the nodes, highlighting those with the most connections.
For Traversals, the graph will play an even bigger role in future. Graph actions, such as removing clusters or single nodes, will be used as feedback to optimize the search queries further.
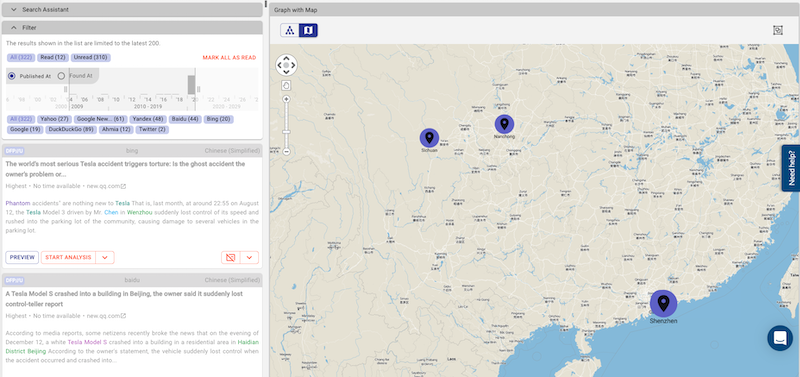
Let’s take a closer look at one of the names that crops up: Tesla.
They’re leaders in AV research and design, and have invested heavily in China, so we’d expect to see their name in the results. Heading back to our search assistant view we can kick-start another, more specific, query.
In a few clicks, we got an interactive overview of articles citing incidents involving self-driving Teslas. At this point, an analyst can quickly find locations of different incidents and when they took place using the ReGraph time bar, uncovering patterns or trends as they go.
Alternatively, they can use ReGraph’s combo feature to simplify the view further. We’ve mentioned Traversal’s sentiment analysis algorithm already. Let’s group the results based on sentiment:
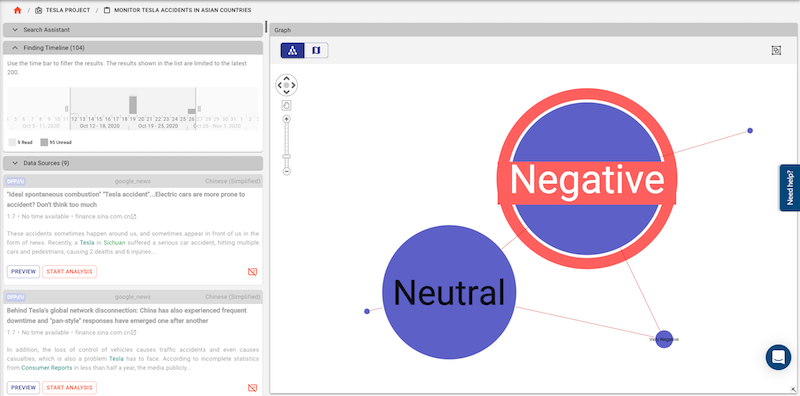
No surprises – a search for car crashes was always going to return mostly negative results – but we can see the value of this approach. Traversal’s sophisticated graph visualization component transforms a vast knowledge graph dataset into a simple grouping of 5 nodes – ready for the analyst to dig deeper at their own pace.
The Traversals team is helping some of the world’s biggest businesses answer their most complex questions. They’ve recognized the power of scalable, interactive graph visualization tools.
If you see potential in it too, we’d love to hear from you.

Visualize your data! Request full access to our SDKs, demos and live-coding playgrounds.
Registered in England and Wales with Company Number 07625370 | VAT Number 113 1740 61
6-8 Hills Road, Cambridge, CB2 1JP. All material © Cambridge Intelligence .
Privacy Policy | Security Framework


