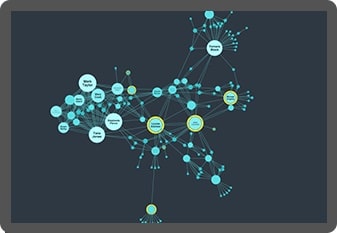
Knowledge graph visualization
Organizations increasingly rely on knowledge graph tools to make the most of their growing volumes of data.
When modeled as a graph, information from across the enterprise can be connected and contextualized, resulting in more accurate answers and clearer explanations.
But a good knowledge graph can do more than just power GenAI behind the scenes as a GraphRAG backend. Effective knowledge graph visualizations can be valuable to everyone – from those developing and fine-tuning the data to those who need to consume it.
Knowledge graphs are inherently visual. Good visualization brings them to life, making them more tangible, intuitive and useful.
Let’s see some examples.
Who can benefit from knowledge graphs?

Finance
Modern finance generates data on a massive scale. Connecting and visualizing it provides a rich source of insight, helping retail banking to maximize customer value, fraud analysts to detect unusual activity and compliance managers to stay compliant.
Pharma and bioscience
Research-intensive organizations generate vast volumes of information, siloed in datastores and files across the enterprise. Knowledge graph visualizations make enterprise-wide search possible and data discovery faster and more insightful.

Retail and e-commerce
Building an outstanding customer experience reduces churn, increases lifetime customer value, and generates revenue. Bringing all customer interaction data into a single place (Customer 360) makes it easier to make better, more profitable, decisions.
This is just a sample – any organization that needs to collate disparate data into a single unified view and apply their own semantic meaning will see benefits from visualizing their enterprise knowledge graph.
GraphRAG for GenAI
Knowledge Graphs have had a surge in popularity recently thanks to GraphRAG. GraphRAG is the use of a graph to complement traditional LLM generation. It’s a match made in heaven – individual users can ask questions using an intuitive natural language interface, but those answers are kept grounded in reality and free of hallucination by ensuring that the LLM can retrieve full context from a curated enterprise knowledge graph.
So where do visualisations fit in? And are they even relevant in a world where a chatbot sits between a user and their data?
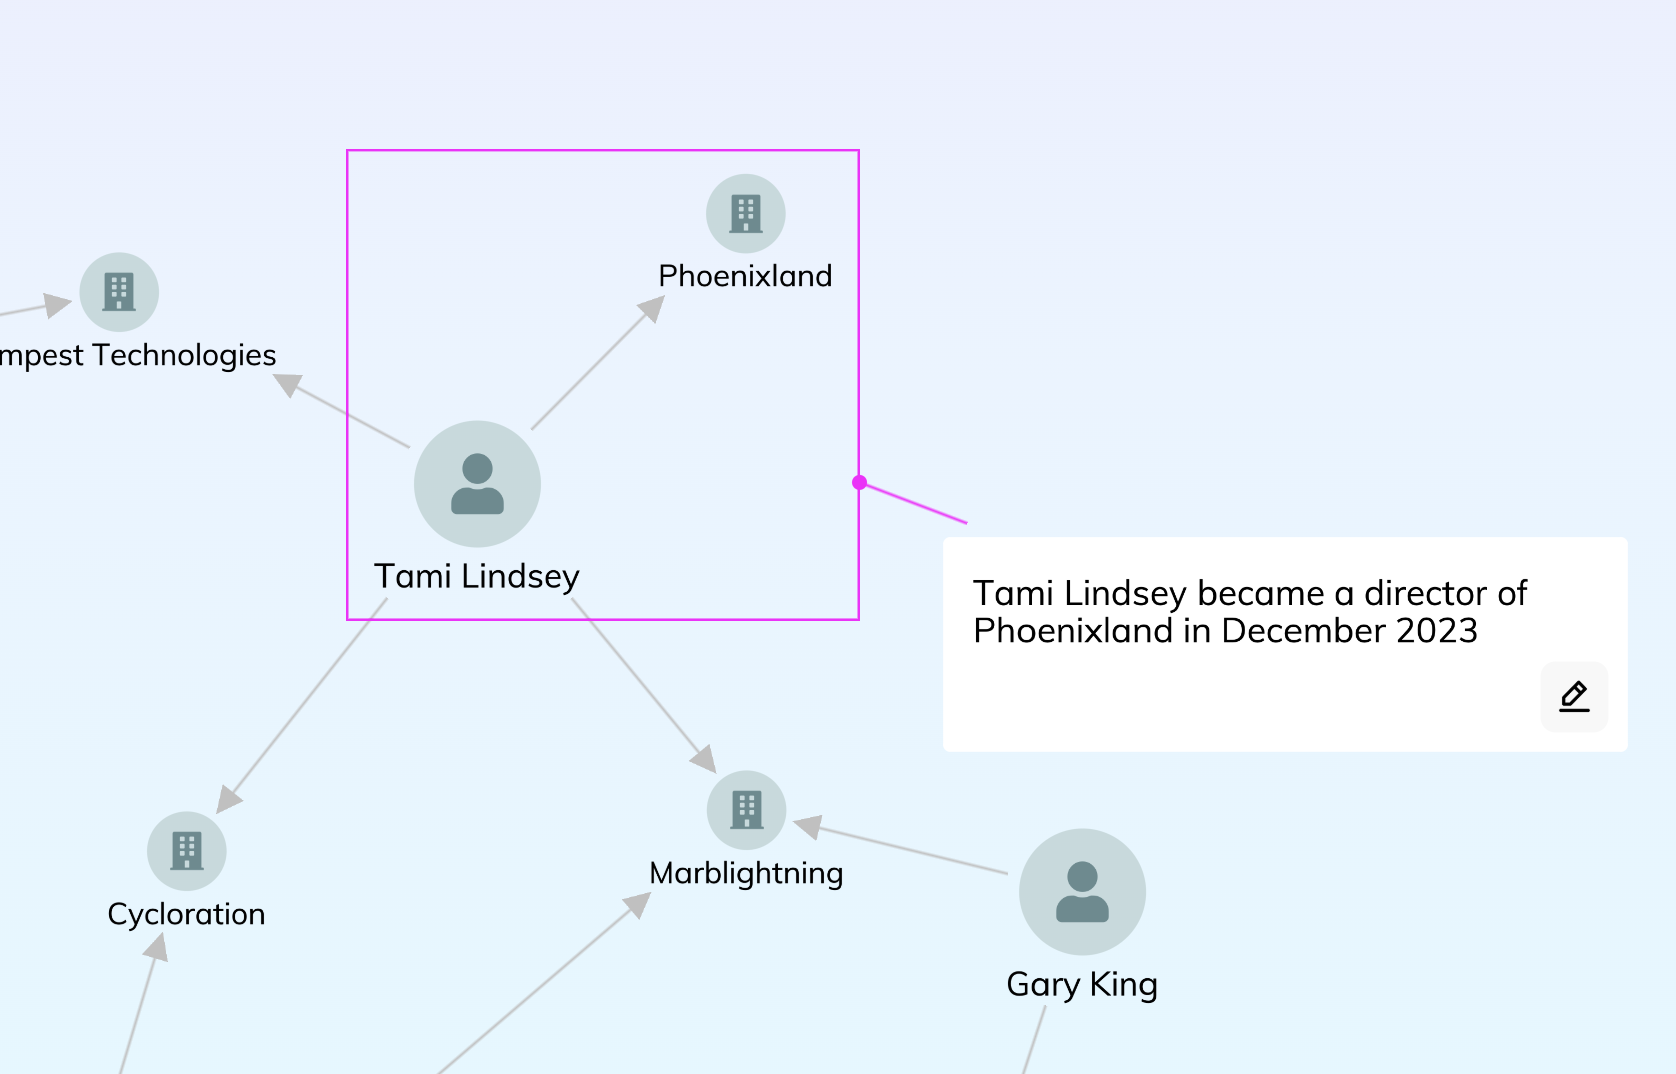
GraphRAG builders can benefit from visualization techniques like aggregation, filtering and visual summary to help them troubleshoot and improve the structures of their graphs and ontologies.
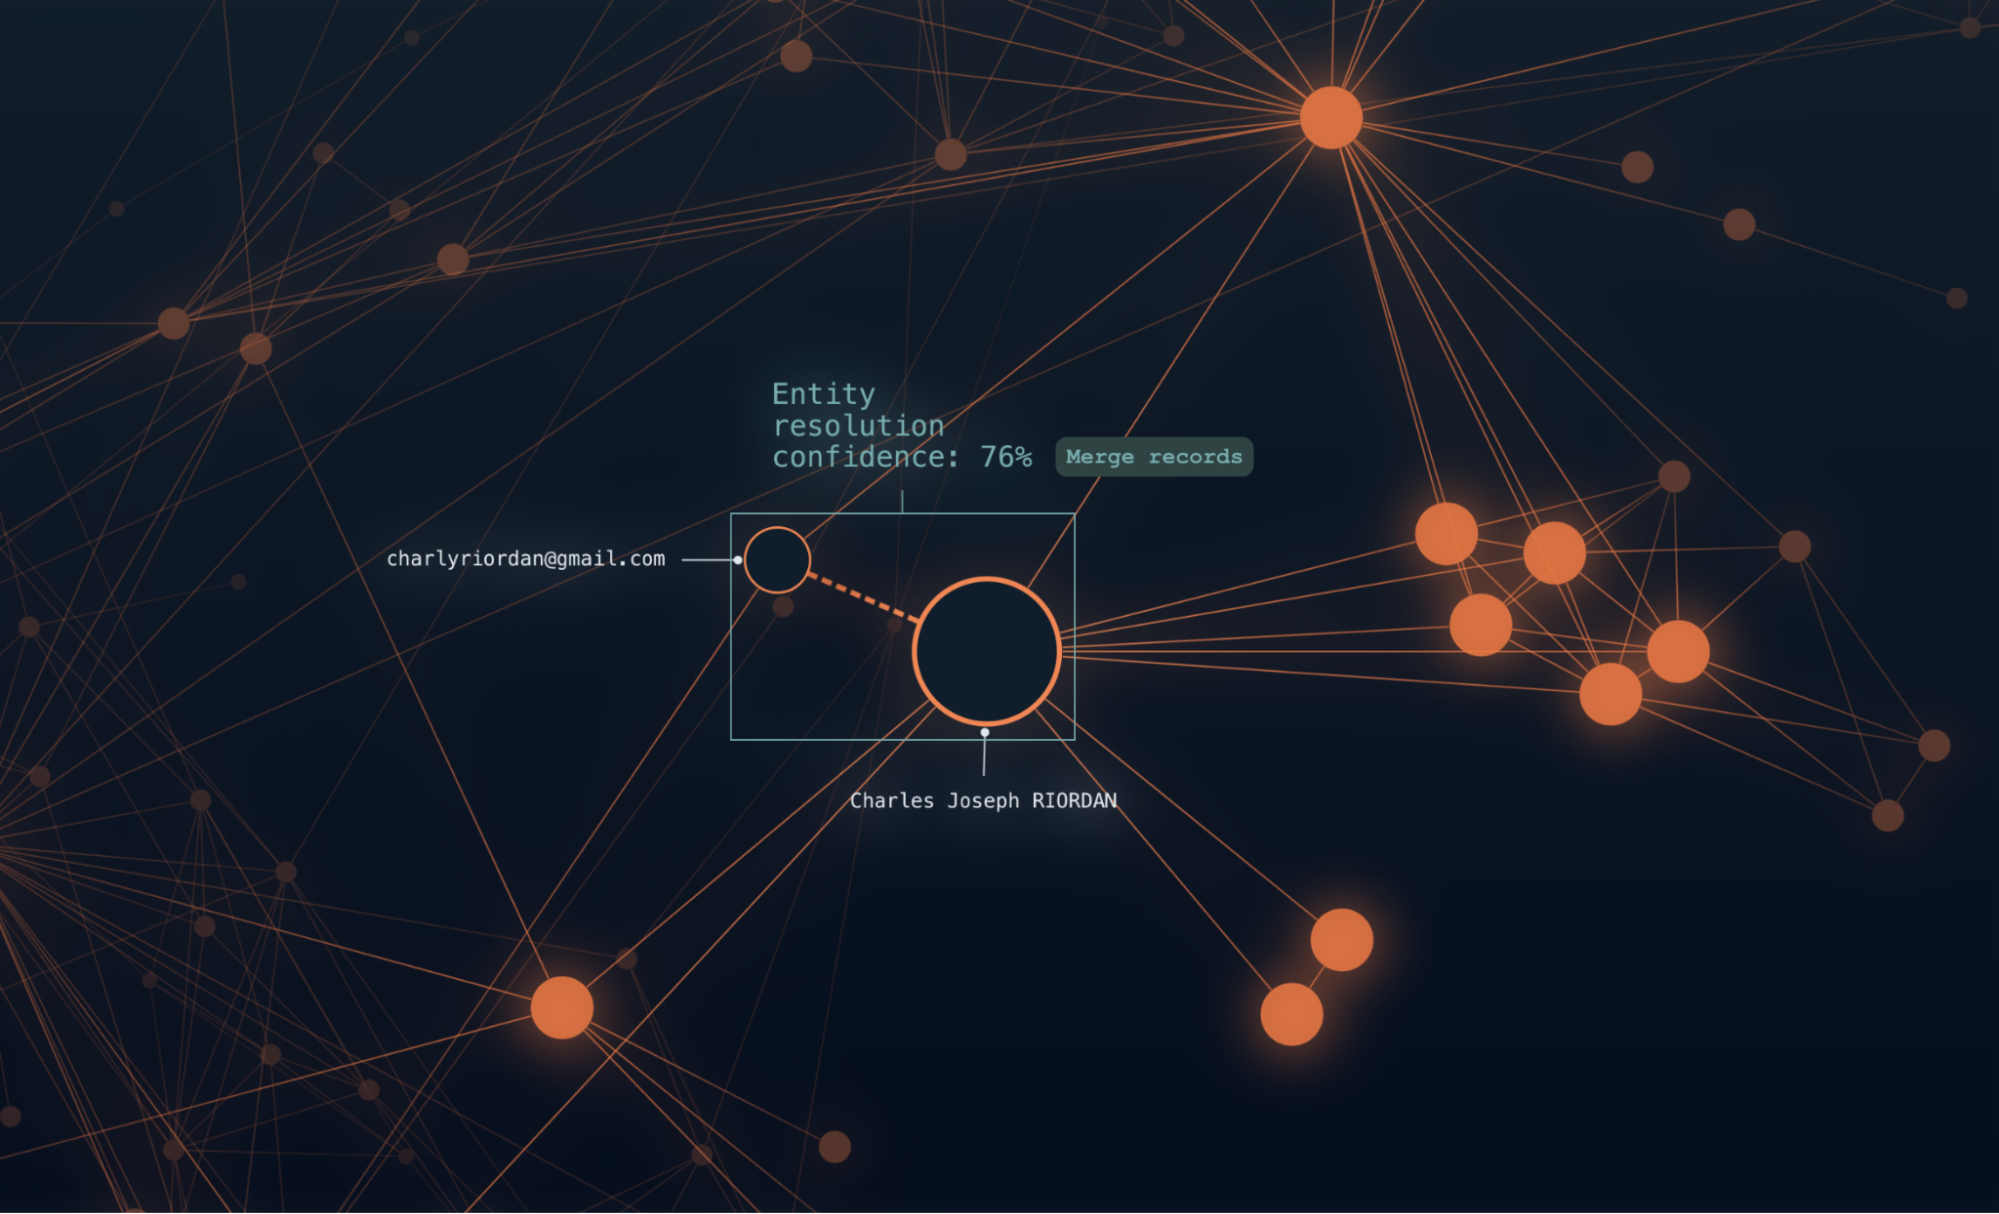
And if your GraphRAG users are only reading the results of GenAI search as text responses, they are missing out on a huge amount of context and insight. They may not need to see the entire knowledge graph, but a visual representation of their query result can turn data into genuine understanding, and also help them trust the response.
Enterprise knowledge management
Successful businesses understand their data, but making sure everyone can access the right data at the right time is a difficult challenge.
Whether it’s a researcher navigating intellectual property and scientific data, or a customer service agent deciding the next up-sell opportunity, knowledge graph visualizations connect information from different domains, models and formats into a single view.
Graph-powered enterprise search and data discovery reveals connections between real-world entities. This gives researchers an intuitive way to explore domain knowledge.
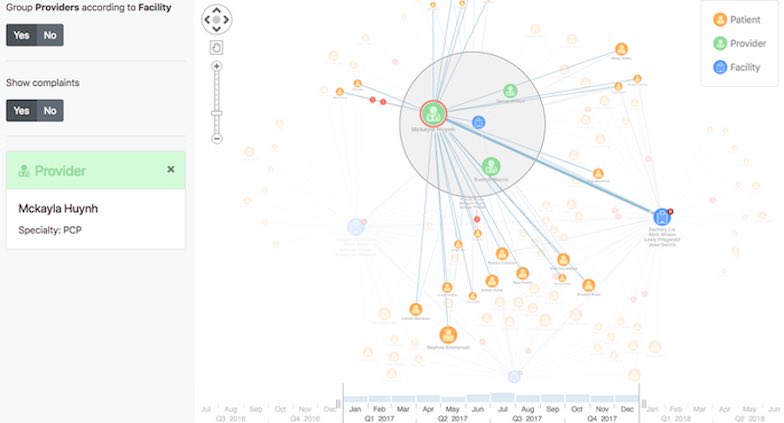
Customer 360 platforms harness knowledge graphs to give a holistic overview of customers – or in this example – patients. Easy access to this information supports strategic planning and complex decision-making, as well as tactical day-to-day decisions made by customer-facing staff.
Learn more in our white papers
We’ve helped governments, banks, and leading software vendors visualize their data.
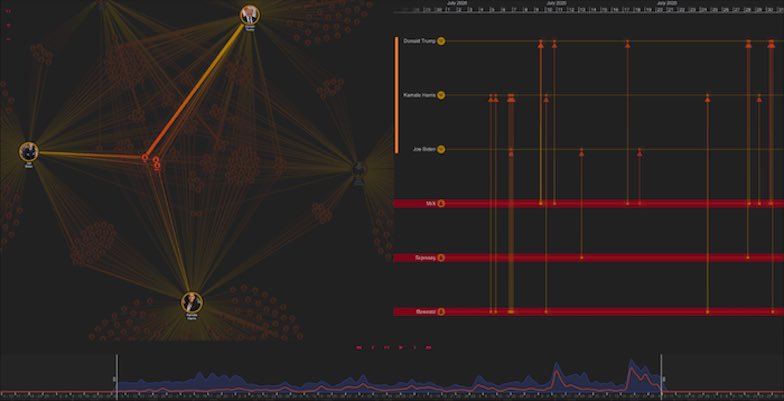
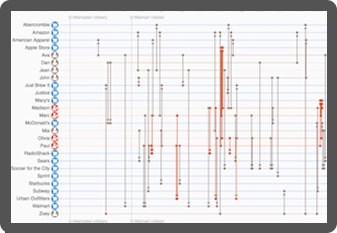
Risk management & anti-fraud
Knowledge graphs create opportunities to manage complex risks and threats in a more sophisticated way. When you present complex and disparate data in a tangible, navigable format, users perform more reliable situational analysis and threat detection. There’s a clearer understanding of the potential impacts of decisions.
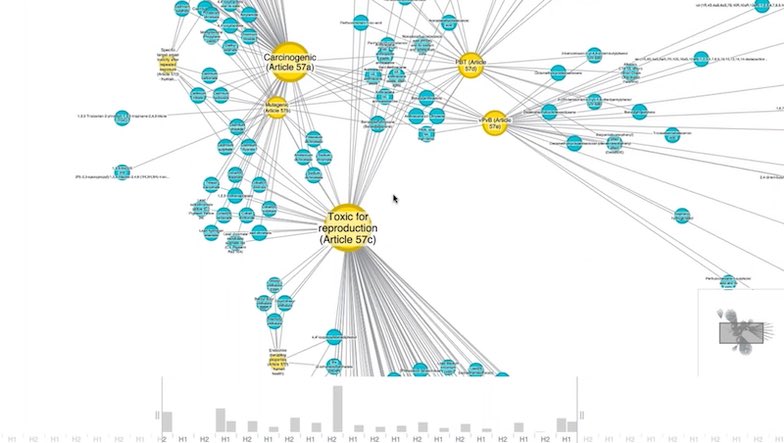
The increasing scale and complexity of laws and regulation make compliance an increasingly data-intensive exercise. Knowledge graph visualizations give compliance managers the tools they need to meet “know your customer” regulations and perform more sophisticated compliance checks across the whole business.
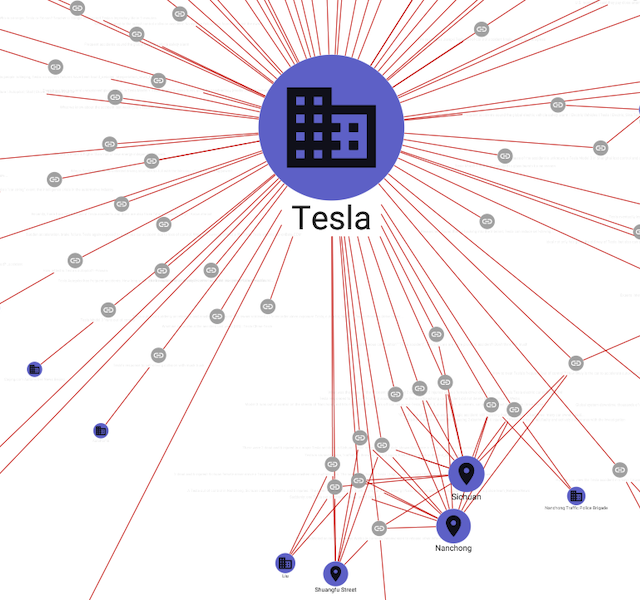
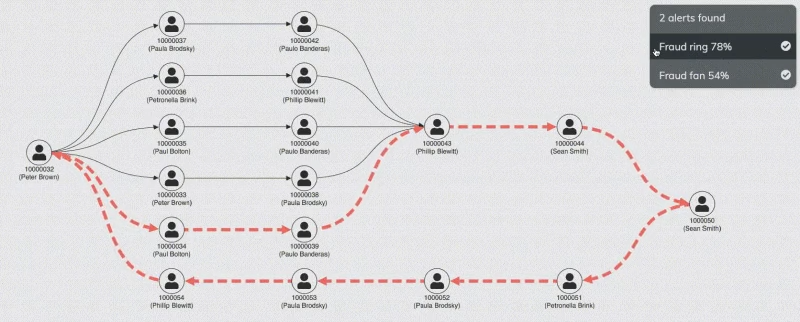
Fraud investigation is about understanding connections. Knowledge graph visualization gives fraud investigators an intuitive interface to understand complex connections between people, accounts, transactions, giving them the context they need to investigate AI-detected alerts.
Knowledge graph visualizations driving process optimization
In a connected environment, small decisions can have big consequences. Organizations need to understand how their systems and processes are connected so they can manage them responsibly. That means knowing where dependencies and relationships exist.
Knowledge graph visualizations reveal this level of insight. They help decision-makers change direction with confidence, knowing it’ll have a positive impact on the business.
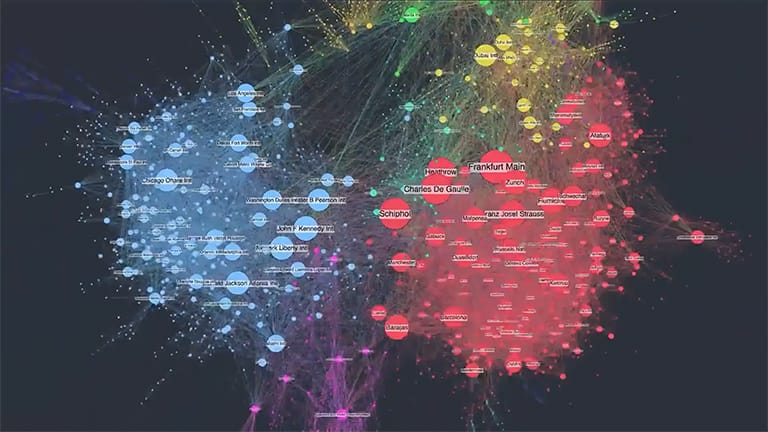
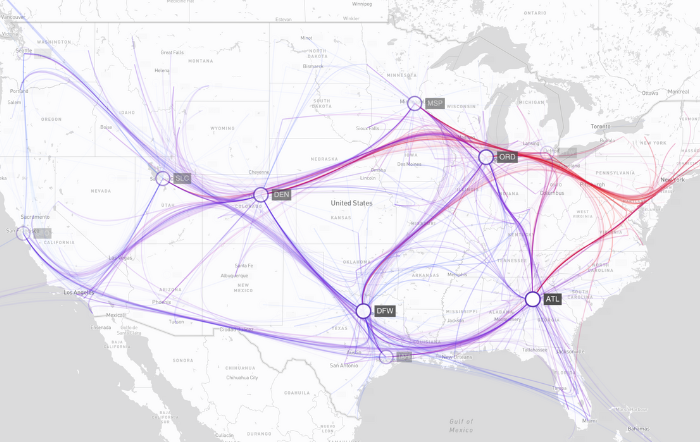
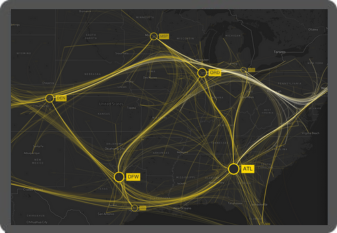
A supply chain is a tightly-interconnected system with a huge network of dependencies. Visualizing these dependencies gives managers the oversight they need to adapt to changes, optimize existing processes and trace materials through every stage of the supply chain.
Build a powerful knowledge graph visualization
We’ve worked with hundreds of organizations worldwide, from national governments to innovative start-ups, helping them to build powerful visual interfaces for their enterprise knowledge graph platforms. Why do they choose us?

Get insight at scale
Knowledge graphs can be huge – but our toolkits are designed for scalability, with intuitive filtering, grouping, and timeline / geospatial aggregations that reveal insight, not chaos.

Intuitive visual models
Whether you’re building with RDF or LPG, we help customers visualize their most complex connections by creating clutter-free visual models from the underlying graph.

The right view for the right persona
Knowledge graphs are most powerful when everyone can use them. By building with our libraries, you can create bespoke views that empower everyone to see connections in data – from data scientists to the CEO.
Want to try it for yourself?
KeyLines
The graph visualization SDK for JavaScript developers
KeyLines is your fast-track to graph visualization success on any tech stack.
ReGraph
Hassle-free graph visualization for React developers
ReGraph for React makes building state-based graph visualizations a breeze.
KronoGraph
Advanced timeline visualizations that scale quickly & easily
Build advanced interactive timeline views, customized for your applications.
MapWeave
Geospatial visualization SDK that uncovers every connection
Build apps that make geospatial connections clear and insightful.