
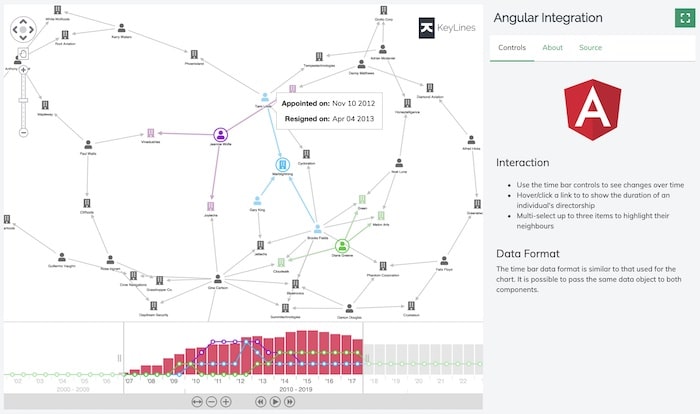
If you’re a JavaScript developer, you’ll already know how easy it is to build web applications using the Angular platform. It’s one of the most popular frameworks around, which is why we created a component and demo to showcase integration with KeyLines.
This developer tutorial walks you through the commands you need to integrate Angular with KeyLines and start coding.
Not using KeyLines yet?
You’ll need to download it to complete this tutorial
What is Angular CLI?
The Angular team released their CLI tool back in early 2017. It’s designed to help Angular web developers automate their workflow, make projects more consistent, and follow best practices. There’s complete documentation available from the Angular CLI GitHub wiki page.
How does this help with developing your KeyLines application? It means you can:
- initialize and scaffold a generic Angular project structure easily
- take advantage of the CLI build tools and development utilities
- test and deploy your finished graph visualization application faster
Let’s start our KeyLines integration by creating a new project.
Build a graph visualization app with KeyLines & Angular CLI
Step 1: Set up your project
First, make sure you’ve got Node.js installed (you’ll get npm in the Node.js download too).
To create the project, at your terminal window, enter:
npm install -g @angular/cli
ng new my-app
cd my-app
ng serve --open
If you’re prompted to add Angular routing, go ahead and accept the default settings.
The app is launched in your browser and the project is now set up in the my-app directory. It already contains all the necessary configuration files and some TypeScript modules to get started with your Angular app.
Now let’s add KeyLines to the new project.
Step 2: Add your KeyLines files
Once you’ve downloaded the KeyLines package from our SDK site (request a trial account), place it in the my-app directory and install it as a package dependency:
npm install file:./keylines-#.#.#-#########.tgz
Next, copy the resource below from the KeyLines package into your Angular application.
The following command, when run from inside the my-app directory, should copy the file to the correct location:
cp ./node_modules/keylines/angular/angular-keylines.ts ./src
To check we’ve set everything up correctly, go to your Angular project page and open your browser’s developer tools console. When you enter KeyLines.info() you’ll see details about the KeyLines toolkit.
Step 3: Set up KeyLines in the Angular component
To keep things simple, we’ll edit the existing Angular application component in the src/app folder.
Let’s update the contents of the src/app/app.module.ts to:
import { KlComponent, KlComponents, KlComponentsService } from '../angular-keylines';

import { BrowserModule } from '@angular/platform-browser';
import { NgModule } from '@angular/core';

import { AppComponent } from './app.component';

@NgModule({
  declarations: [
    AppComponent,
    KlComponents,
    KlComponent
  ],
  imports: [
    BrowserModule,
  ],
  providers: [KlComponentsService],
  bootstrap: [AppComponent]
})

export class AppModule { }
Now we’ll update src/app/app.component.html with kl-components to inject the components into our template:
<kl-components (klReady)='klReady($event)'>

  <!-- chart -->
  <kl-component klType='chart' klContainerClass='chart-container'></kl-component>

</kl-components>
Edit src/styles.css to set dimensions for the KeyLines chart:
html {
  box-sizing: border-box;
}

*, *:before, *:after {
  box-sizing: inherit;
}

body {
  margin: 0;
}

.chart-container {
  width: 100vw;
  height: 100vh;
  padding: 16px;
}
Finally, let’s edit src/app/app.component.ts to add some data and a handler for the klReady event:
import { Component } from '@angular/core';
import type { Chart, ChartData } from 'keylines/esm';

@Component({
  selector: 'app-root',
  templateUrl: './app.component.html',
  styleUrls: ['./app.component.css']
})
export class AppComponent {
  title: string = 'my-app';

  chart!: Chart;

  data: ChartData = {
    type: 'LinkChart',
    items: [ { type: 'node', id: 'n1', c: '#43976C', t: 'Hello World' } ]
  };

  klReady([chart]: [Chart]) {
    // save the chart reference
    this.chart = chart;
    // load the data into the chart
    this.chart.load(this.data);
    this.chart.layout();
  }
}
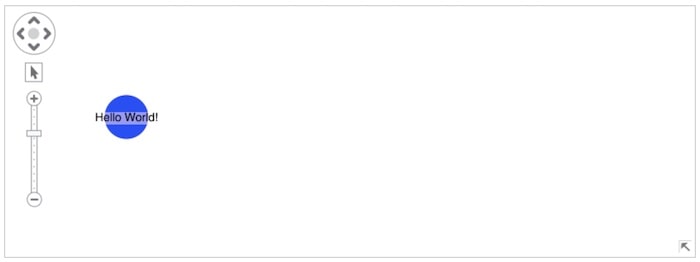
The klReady function now gives you access to the chart objects, and in turn, the full power of the KeyLines API.
Here’s your simple KeyLines chart:
Ready to try?
You’ve seen how quick and easy it is to get your KeyLines project set up using Angular CLI, so you can focus on developing your graph visualization application. You’ll find a more detailed Angular tutorial on the KeyLines SDK, together with a fully-documented demo.
Want to set up KeyLines and Angular in your own environment? Sign up to request a free trial and you’ll be coding in no time.
This post was originally published some time ago. It’s still popular, so we’ve updated it with easier configuration details in line with KeyLines best practice.
Share:
