
Graphs can reveal trends and give insight into relationships between people, times and locations. They’re a vital tool for visualizing crime data at scale so it can be explored and understood.
In a previous post on law enforcement and big data visualization, we saw how law enforcement agencies understand the wealth of data they have at their disposal.
This blog post gives another law enforcement graph visualization use case, and one that I recently presented with our partners at Neo4j.
Watch Neo4j’s webinar on analyzing law enforcement data at scale
Visualizing the data.boston.gov crime data set
One of the many sources of data available to the police is their RMS – or Records Management System. It’s often the core repository, containing details crimes, individuals, officers and vehicles, etc.
In recent years, many agencies have made some of their RMS data available to the public – a great resource for anyone interested in law enforcement activity. Obviously, identifying details are stripped out, but there’s still enough for us to demonstrate visualizing crime data at scale.
One example of this is the City of Boston’s open data hub, detailing real-life crime incidents in the city.
Creating the data model and loading into Neo4j
Once I’d loaded this dataset into the Neo4j graph database, I could use Cypher query language to quickly and easily query the data.
I used the Neo4j Awesome Procedures on Cypher (APOC) capability to call the data.boston.gov API, pulling in a JSON object detailing 1000 records. APOC provides a flexible way to ingest data into Neo4j with a few lines of Cypher. I used Incident Number fields as the core nodes with additional attributes, like offense group, district, date, longitude and latitude.
Finally, I added another set of nodes – crime descriptions – plus a link between the two node types. Here’s our data model:
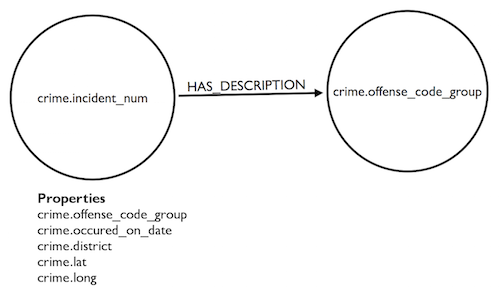
And here’s the original Cypher:
	CALL apoc.load.json(https://data.cityofboston.gov/resource/29yf-ye7n.json?$limit=1000&$offset=0)
	YIELD value AS crime
	MERGE (c:Crime {incidentnum: crime.incident_num})
	ON CREATE SET	c.offense=crime.offense_code_group,
					c.date=crime.occured_on_date, c.district=crime.district,
					c.latitude=crime.lat, c.longitude=crime.long
	MERGE (desc:Description {name: crime.offense_code_group})
	CREATE (c)-[:HAS_DESCRIPTION]->(desc);
Visualizing crime data at scale with KeyLines
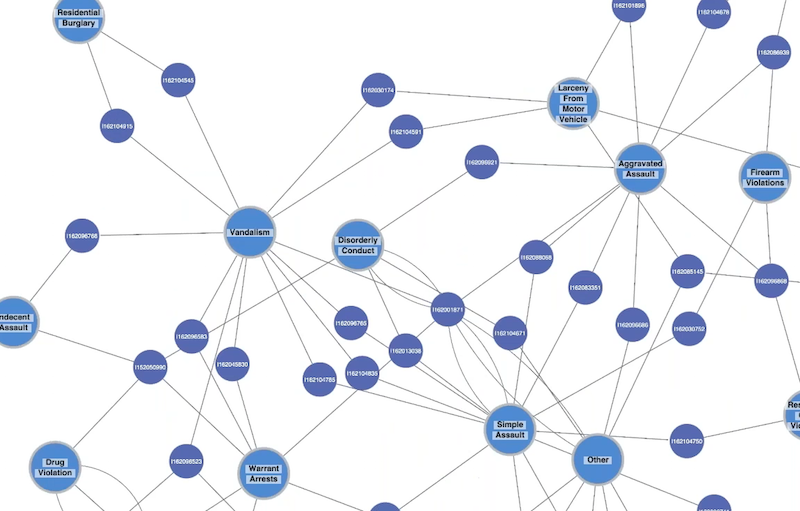
Next, I wanted to translate 1000 lines of crime data into something more compelling – a KeyLines visualization:
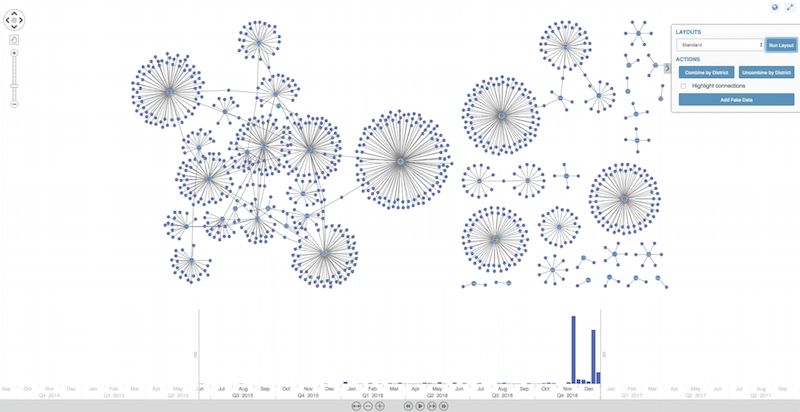
These are Crime Categories (the central nodes) connected to actual crimes (the outer nodes). We can spot some basic patterns at a glance. For example, in our dataset there’s only one located missing person:
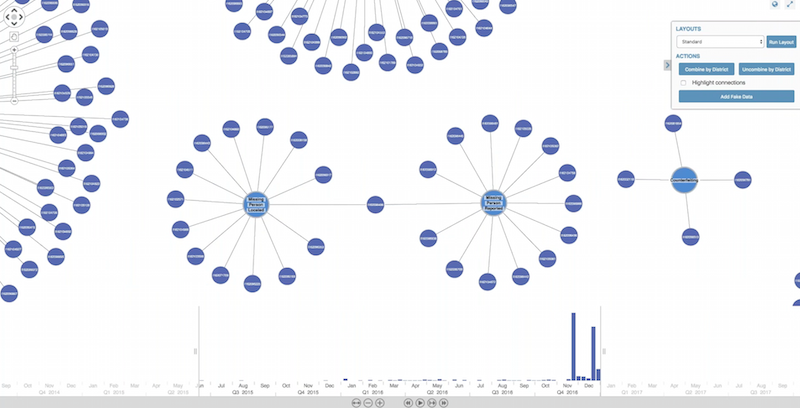
This doesn’t suggest that the police have problems locating missing persons; it’s probably due to our limited dataset. With full access to the data, we might use a double-click to expand method to see the full picture.
Looking at Crime Category connections
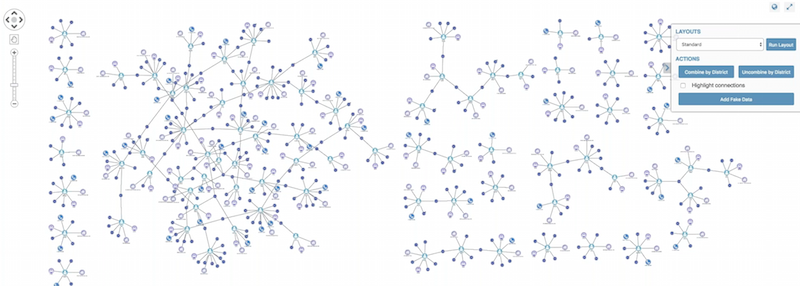
We can also see some categories are more densely interconnected than others. Filtering out ‘leaf nodes’ (nodes with only a single connection) reveals network of inter-related crime categories:
Inspecting crime by district
There was a District property in our original dataset, so we can incorporate that into our visualization.
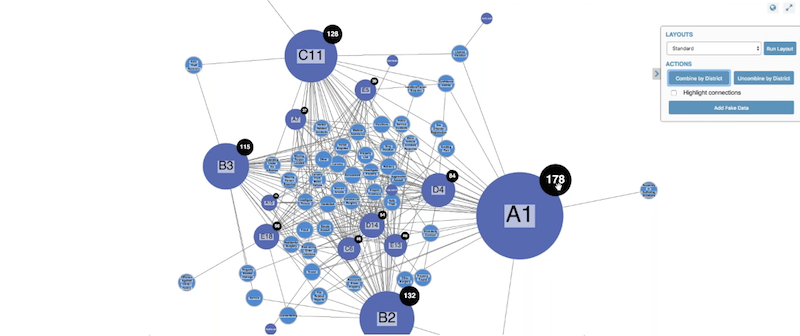
KeyLines Combos feature makes it easy to combine nodes based on any feature. Let’s combine by district, to see which geographic areas report the most crimes:
We can also use the latitude and longitude information on the nodes to see the crimes in a geospatial view:
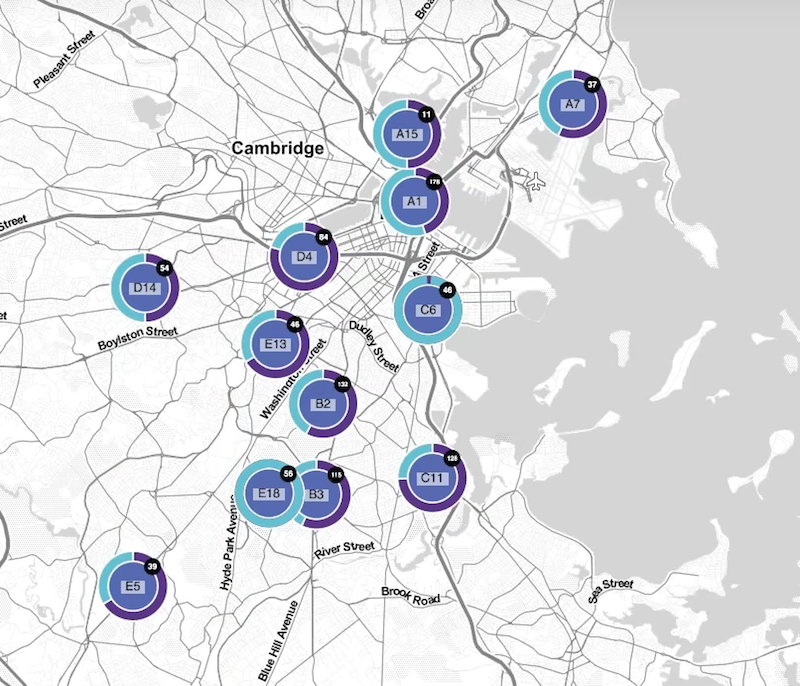
I’ve also added donuts to nodes to show the volumes of different reported crimes. I’ve included two crime categories – Larceny in blue, Motor Vehicle Crime in purple – but we can already see some stark differences in our dataset. South Boston (C6) has a much higher proportion of Larceny than East Boston (A7).
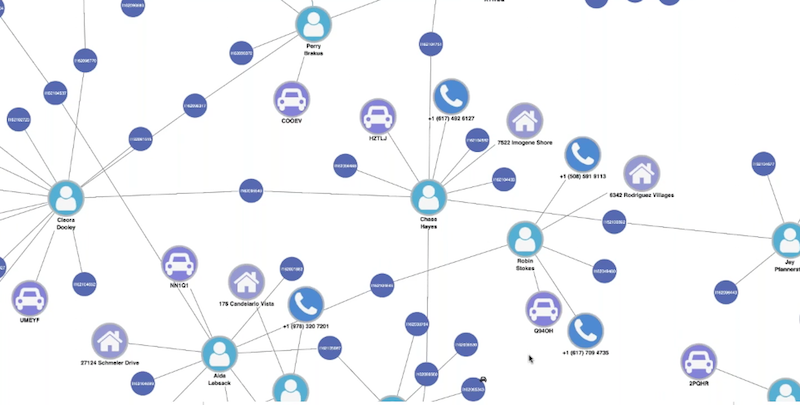
Adding people, phones, vehicles and times
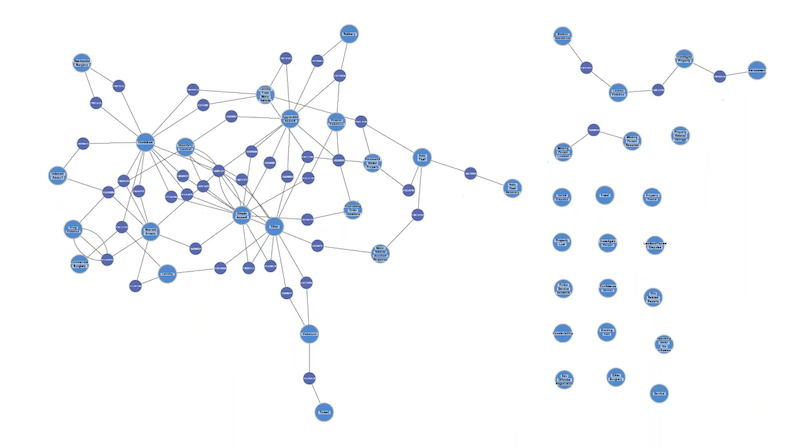
We don’t have access to real-world crime data. To give you some idea of what a police officer might see, I used GraphAware’s excellent GraphGen tool to supplement the data with additional (fake) attributes:
The fake data doesn’t reveal much insight, but it demonstrates the potential value of this approach. An officer can visually explore phones, addresses and individuals connected to incidents to see how they relate to previous incidents.
We can enhance this view with the KeyLines time bar, which lets us drill down to specific time periods:
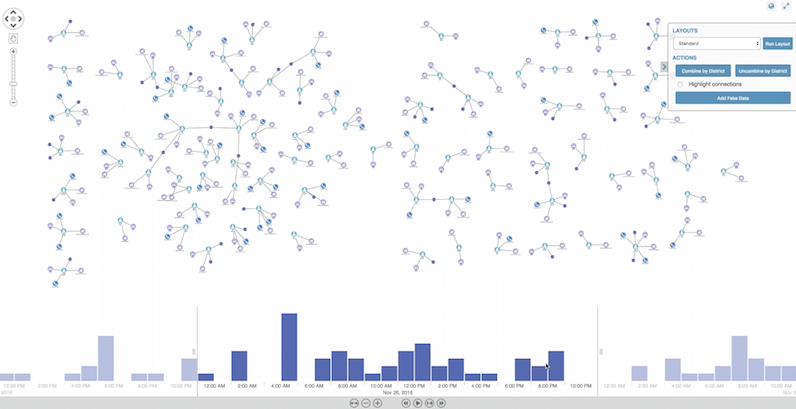
Storing data in a Neo4j graph database means we can run complex graph queries that would otherwise be incredibly time-consuming.
“Return all individuals in district D4 who have previously been associated with a vandalism crime in 2017 who drive a red Ford” becomes a fast and simple Cypher query. KeyLines and Neo4j combine to become an effective and efficient tool to help officers make the best use of their data.
Want to try it for yourself?
This post is just an illustration of visualizing crime data at scale, and how graph visualization techniques can help law enforcement to understand complex connections. We’d love to see how this approach works using real-world data. If you’d like to try KeyLines for yourself, just request a free trial or contact us.
Share:
