In this webinar, David Burnett of Cambridge Intelligence is joined by Guiseppe Francavilla and Valerio Fumi from Sistemi & Automazione.
They’ll discuss the immense data challenge facing law enforcement investigators and we’ll get to see how their TETRAS product addresses this challenge by turning raw data into admissible evidence.
We’ll also see how KeyLines-powered visual analysis functionality complements IBM i2 exports, making it faster and easier to reveal timely, precise intelligence.
Successful COMINT data analysis in 5 steps
Prefer a written version? Here’s an illustrated write-up.
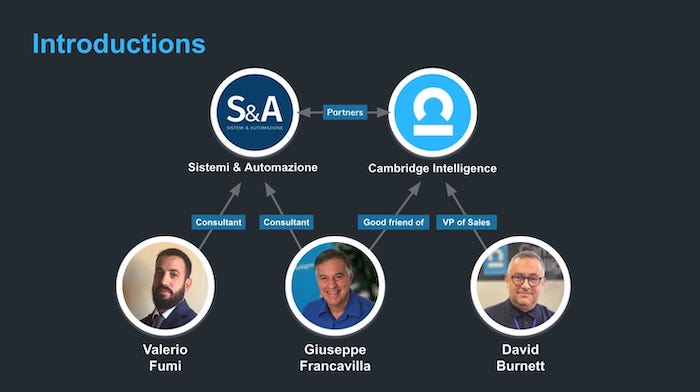
Meet your presenters
Thanks for joining us today, as we take a look at the five components of a successful COMINT analysis strategy. First, some introductions.
I’m David Burnett, Head of Sales at Cambridge Intelligence, with 20 years of experience in the cybersecurity sector. I’ll open this session by looking at the challenges of communications intelligence (COMINT) analysis in law enforcement.
I’m delighted to be joined today by two experts from one of our partner organizations, Sistemi & Automazione (S&A). Sistemi are one of the major suppliers of investigative solutions in Italy and Europe.
Giuseppe Francavilla began his career in the Italian Finance Police, before moving to the commercial sector with roles at IBM and BAE Systems, and several happy years at Cambridge Intelligence. At Sistemi, he applies his experience to their extensive range of data analysis products.
Valerio Fumi is a training consultant for Sistemi, helping their customers to extract intelligence from call data records and social media data. He also has experience as a criminal lawyer, an intelligence analyst, and a trainee judge working on a number of cases covering white-collar crime, drug trafficking and the mob.
Together we’ll identify the five components needed for successful COMINT analysis in law enforcement. Valerio and Giuseppe will then end the session with a demo of Tetras, Sistemi’s popular platform for law enforcement COMINT analysis, and show you how KeyLines powers its new visualization functionality.

David Burnett
Global VP of Sales, Cambridge Intelligence
Police investigations: fiction vs reality
When most people think of police investigations, they imagine something like this:

We’ve all seen this kind of investigation wall in TV shows and films: a sprawling map of paper and pins, joined with bits of string by police officers investigating a single incident. The reality is quite different, and much more high-tech.
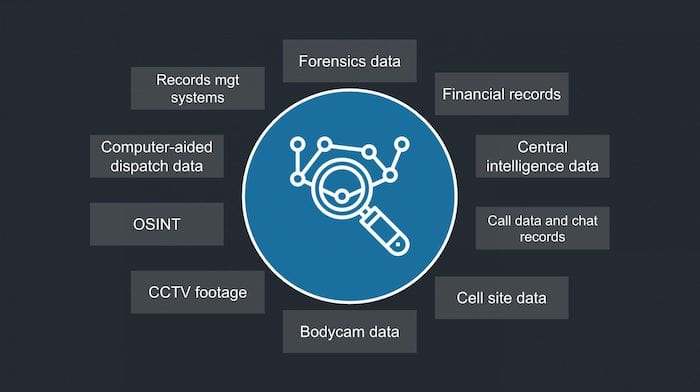
Communications intelligence includes call data records, open source intelligence, incident and investigations reports, databases, financial records or body cam data. Police investigations involve massive amounts of data, so investigators and analysts need to be comfortable with complex data analysis. They need to know how to turn data into intelligence that will support them to either make an arrest or secure a conviction.

Giuseppe Francavilla
Consultant, Sistemi & Automazione
Tackling the COMINT analysis challenge
COMINT analysis is an increasingly important part of law enforcement. It allows investigators to connect suspects to incidents, locations and other individuals, but it’s not a simple task. Based on our experience at Cambridge Intelligence and S&A, we’ve identified five key components of a high-performing analytical solution:
- Efficient data collection
- Graph data analysis tools
- Link, timeline and GIS visualization
- The ability to disseminate intelligence
- Alignment of information, data and applications
1: Efficient data collection
The first challenge is to acquire, structure, and store data in an efficient way. The data involved in COMINT is big, varied, and extremely complex. Printouts and downloads can include thousands of data points, from phone calls and cell tower pings to online banking data and internet browsing history. There’s a huge technical challenge before we even get to the analyst experience.
2: Graph data analysis tools
The next part of the solution is to give analysts the best possible tools for uncovering the insights buried in their graph data. Crimes are increasingly planned and committed online, and the investigator often has only an IP address or a subscriber account number to work with.
The human behind those accounts could be anyone. But if you have an application which can combine the subscriber information with a handset location, or someone’s social media history, then you can start to build a narrative.
We like to say the analysts are trying to connect people to their ‘digital shadows’ – the traces they leave behind when they use a device, contact another person, or visit a location.
Want to know more about graph analytics?
3: Link, timeline and GIS visualization
The third component is the visualization itself. It can be expressed through different dimensions – like time and space – to support link analysis. The analyst needs to combine the pieces to understand the full picture, so there’s a challenge of ever-growing complexity for investigators and analysts. Police investigations in particular are often slowed down by legacy technologies that don’t work the way modern policing needs them to – and tight resources around both people and funds.
4: The ability to disseminate intelligence
The fourth component is vital because you need to be able to export and share the results of your investigation quickly and easily, in a format that can be used by other applications – for instance high-res images in custom PDF reports.
5: Alignment of information, data and applications
A good investigation works like an orchestra in which the information, data and applications are the instruments. Each one has its own characteristics and plays its own role, but they must be synchronized and aligned so they can ensure the same truth in every task.
Turning raw data into admissible evidence with Tetras (Telephone traffic system)
Sistemi & Automazione developed Tetras 20 years ago, when telephones were really simple devices. As personal communication has evolved, so has the application. Phones can now exchange information in many different ways: Tetras can analyze anything stored on a phone, from SMS and calls, to IP connections, or banking connections.
Tetras is a client-server architecture. This is important, because when there are tasks that could take longer or require more resources, they are automatically assigned to the server. In this way the analyst working on front-end interactions can get on with their tasks without having to wait for the completion of back-end processes.
What we’re presenting today is a desktop application, but there’s also the option for web access. This gives managers the flexibility to carry out quick queries in complete freedom, from any device. The structure of Tetras reflects the way investigations are carried out, so it’s divided into cases and sub-cases.
The real purpose of the application is to be able to bring together the ‘digital shadows’. They could be email accounts or subscriptions, or just the metadata of a call or an IP address connection. These elements help to build the profile of a real person, a real subject or a real organization.
Collecting communications intelligence data
Tetras is a very powerful tool for data acquisition because in most cases, it’s completely automatic. If you have a printout or a download of call data records (CDRs) or other forms of communications, and you submit that to the system, it’s automatically imported. Tetras supports more than 250 data formats, and others can be developed for different data providers by the specialists at S&A.
When you import a list of calls, the phone numbers are automatically set in a standard format, which is the international prefix, national prefix, and the number itself. You can import not just CDRs, but also IP network logs, social media logs, lists of cell towers or people. Tetras can also ingest extractions from any device, from cellphones or tablets to the most commonly used PCs and laptops on the market.

Valerio Fumi
Training Consultant, Sistemi & Automazione
Pre-analytics and smart analysis
The pre-analytic tool is one of the most powerful parts of Tetras. It starts automatically, carrying out pre-analysis of your COMINT data as soon as the import is complete. It provides the analyst with a complete overview of the data imported. You can display your imported data according to ‘occurrences on case’, the relevant, or less relevant presence of targets, and any elements of interest in your case.
You can drill into details across the data, and visualize it in a variety of aggregated formats, including pie charts, histograms and bar charts, to see how much traffic has been exchanged and with whom.
The next tool is smart analysis. This attempts to answer some of the most common queries a law enforcement agent is likely to ask when first investigating some new data – based on S&A’s 20 years’ experience in this field. Starting from here, the application quickly and automatically performs a query to identify interesting connections in the data – like the most contacted phone of a target. You can also use this tool to perform more advanced queries, for instance to see if people were in the same place at the same time.
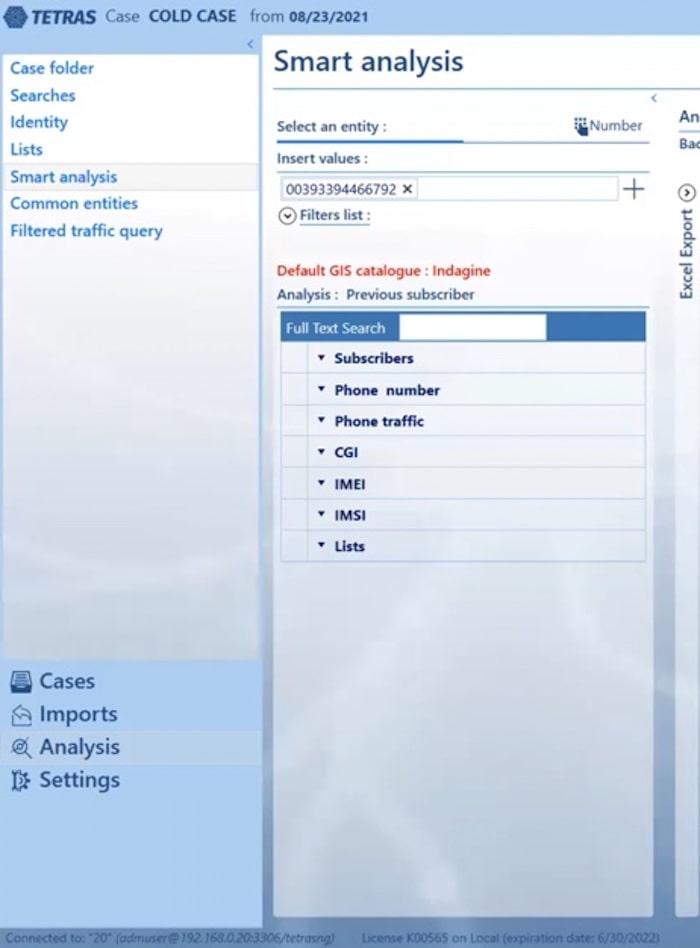
One of the most impressive features of Tetras is its ability to connect every kind of entity from a cellphone download or print-out in just one directory. Everything from web accounts, emails and phone numbers is stored in a single place for analysis. Information can also come from social networks, social media or manual and physical observation from police or law enforcement.
Crime data visualization in action
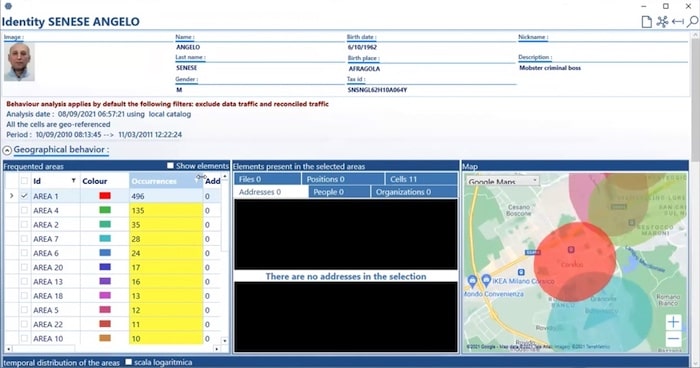
This is a summary of what you can achieve through Tetras’ behavioral analysis feature. You can focus on both devices and communications, and on people and their relationships. The map visualization displays a target’s social patterns and movements by identifying the people they have been connected to the most, and the cell towers and paths they have followed across both foreign and national territories.
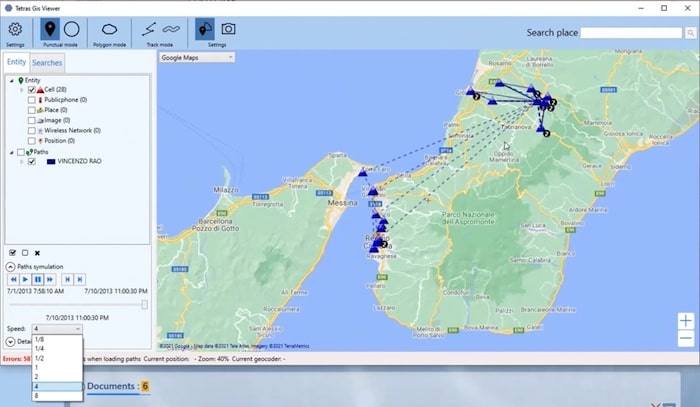
You can display every movement your target makes, simply by giving time-stamped data to the software. This kind of insight can be incredibly useful when cross-examining a witness or investigating a subject’s statement about their movements.
Finally you have the summary report function, which the analyst can run once the data analysis is complete. You can amend or add data, before distributing it in PDF format.

Giuseppe Francavilla
Consultant, Sistemi & Automazione
An example investigation using Tetras
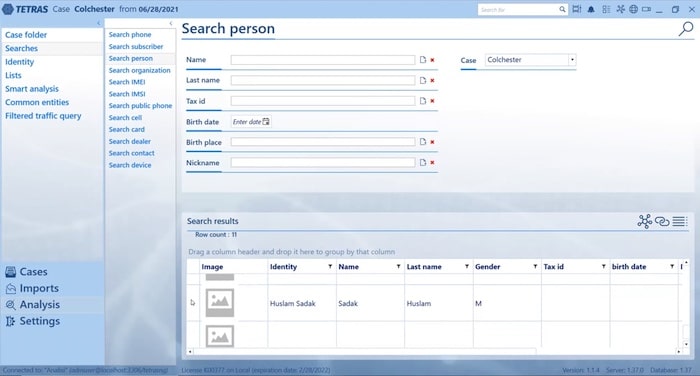
In this demonstration we’ll run through an example investigation into an imaginary target named Huslam Sadak.
We select the investigation and then bring up a list of the people involved. In this example we have some new intelligence on a target called Huslam Sadak, so we select him and send him to the viewer. Tetras uses a visualization component that was created using KeyLines, which allows users to view their connected data as an interactive graph visualization.
From our KeyLines chart we can see that Sadak has an association with another person, two SIM cards and a cellphone.
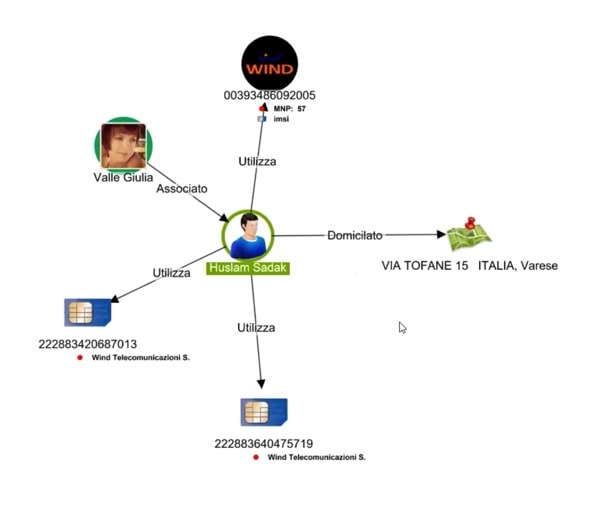
We can also see his home address. We can click on the cellphone and select ‘Subscriber’ to find the name of the account holder, Debbech Kamel.
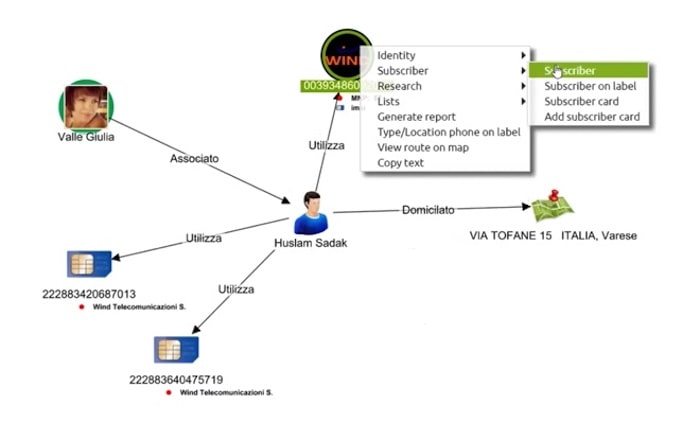
We then search for people with a name the same as or similar to Debbech Kamel, who also have accounts with that cell phone provider. We can review the call records for each of their phones as well. In this example we can see the same identity is attached to four other devices, and can probably assume they’re all the same person. To keep our chart tidy, we can combine them using KeyLines’ combo feature.
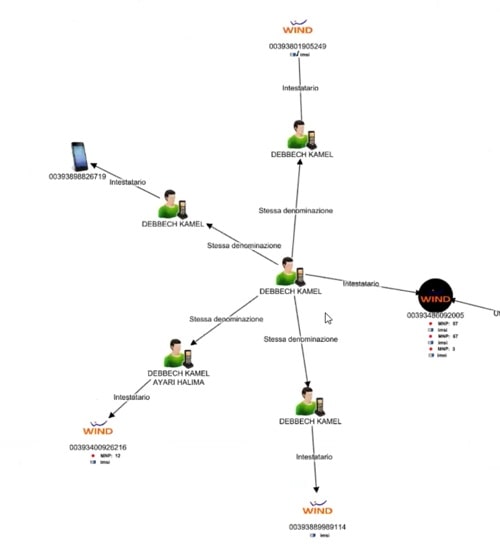
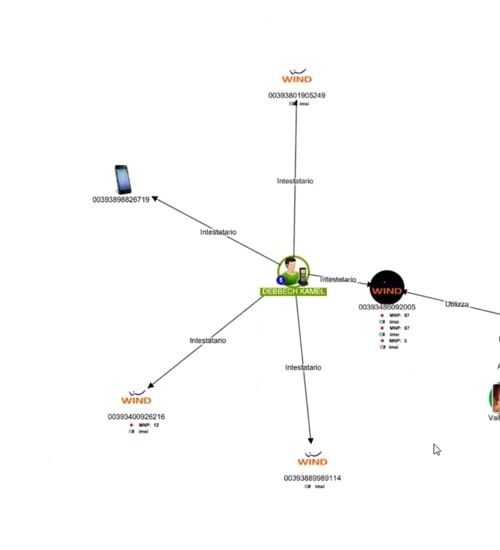
Now let’s see what else we can find out. We can apply a huge number of parameters to our queries.
In this example, we’ll focus on a series of calls made by one person between 8pm and 11pm. The calls were fairly short, so we can filter for calls between 10 seconds and 2 minutes in length. We’ll ignore the shorter calls because according to the intelligence we have, they were only voice over internet protocol (VOIP) calls.
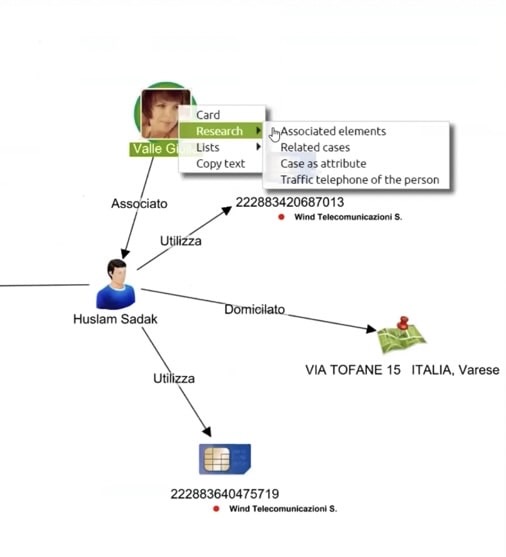
After we’ve run our query, we can add all the calls from our list to the KeyLines chart. One person, Valle Giulia, seems interesting.
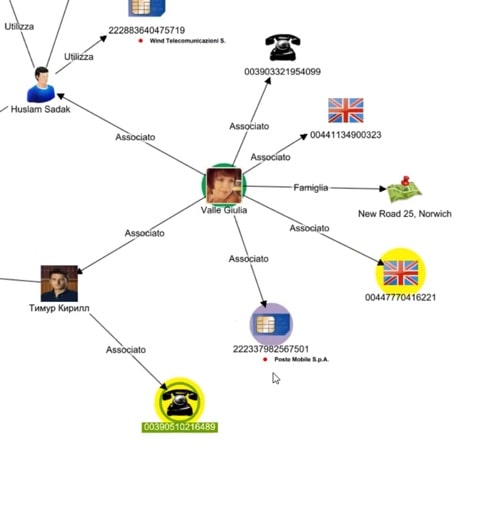
Giulia is connected to Sadak, and also to someone called Kirill – who is connected to the same cellphone as Sadak. The yellow highlights on two of the phones show that they are part of the same list that sits in our investigations database. We’ll bring this list into the visualization, to find out what connects the two phones.
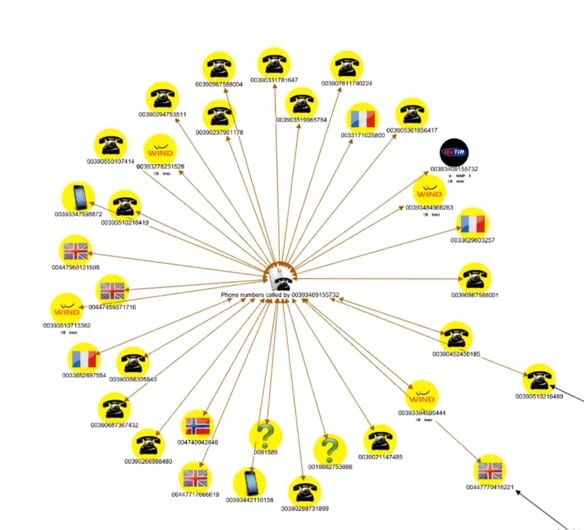
You can see here that the list has been made for phones connected to a specific number that we have previously investigated. One of the other phones on the list is interesting as it has a black frame, which means that it has also been involved in other investigations.
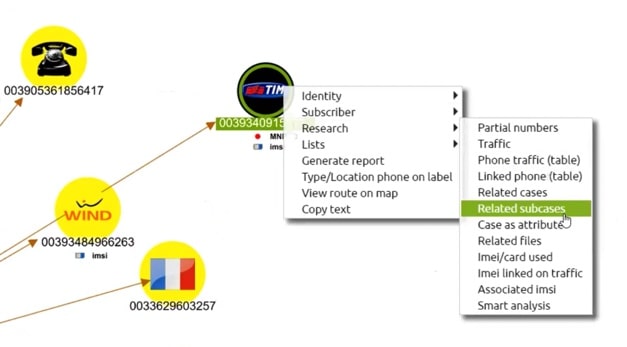
One small thing to note is that Tetras identifies the phone numbers, and also their telecom provider and, in the case of a foreign number, it adds a flag to show the nationality. These small visual cues are incredibly helpful during an investigation, where the analyst needs to quickly find their way through a large and complex dataset.
We can check for matching phone numbers from other databases and charts, and merge that information into the same node. We can also view phones grouped by cellphone provider, country, nationality, and so on.
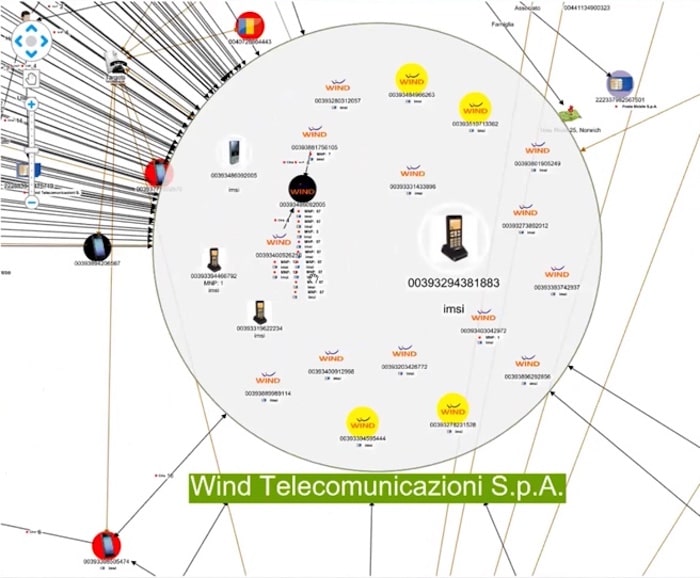
We can then search for the phone on other target lists, and continue importing and merging data from other graphs. After each new import, we can bring together more data for each target in our investigation. S&A have built the capability to import data from other formats, including the i2 Analyst’s Notebook, so we can see it all in one place on the KeyLines chart.
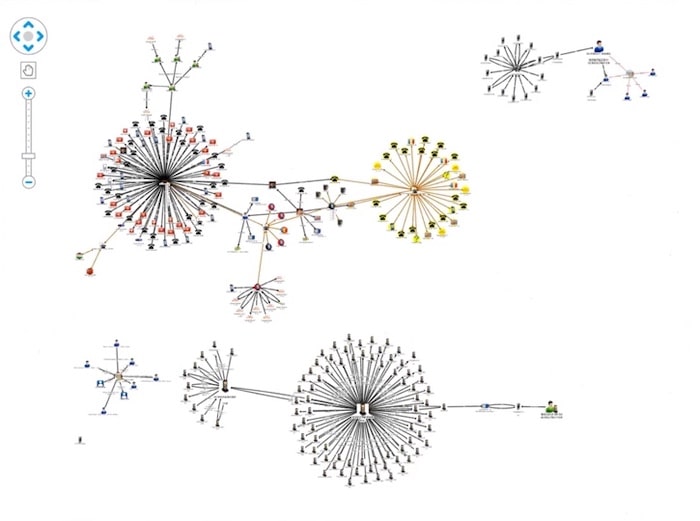
This is the resulting graph visualization for all the data we’ve imported for our example investigation. When we’re happy with it we can save our graph. From there we can continue working on it, send it to colleagues or merge it with other information. And that brings us to the end of the demonstration.
Thanks everyone!
Try out KeyLines for your own application
KeyLines is a web-based JavaScript engine for building graph data visualization applications. It’s designed to work across any device and easily slot in on top of any data source, both graph databases and other types of data, NoSQL and standard RDBMS-type data. Request a free trial so you can play with the toolkit for a few weeks to create your own graph data visualizations and see if it makes sense for you.
About Cambridge Intelligence
At Cambridge Intelligence, we help our customers visualize and analyze connected data. Connected data can take many forms, for example:
- Communication channels between terrorist cells or criminals
- Entities involved in cybersecurity attacks and the inception of those attacks
- Financial transactions between accounts
- Tracking shipments as they travel between manufacturers and wholesalers in a supply chain
We have over 200 customers worldwide, and they work in a number of different domains. One of our products, KeyLines, is a JavaScript library, and you’ll see in this demonstration how it helps uncover and highlight parts of data that may otherwise have been overlooked.
About Sistemi & Automazione (S&A)
S&A has been one of the leading European suppliers of investigative solutions to government, financial and utilities organizations since 1996, when they were the first distributor to introduce link analysis visualization software to Italy. As well as Cambridge Intelligence, they are partnered with a range of other market leaders including IBM and Cognitec. They have deployed Tetras, their application for call data record analysis, to 800 sites all over Europe where it’s currently used by over 2000 analysts.