Stop making your users read: Why font icons are the key to better graph UX/UI
Courtney Collins Product Manager
12th January, 2026 | 5 min read
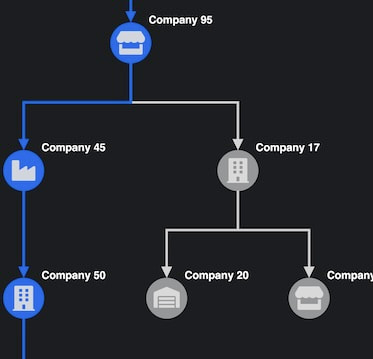
Font icons give graph viz users instant, universal cues: no translation needed, no mental...
A guide to React graph visualization
Courtney Collins Product Manager
22nd July, 2025 | 10 min read
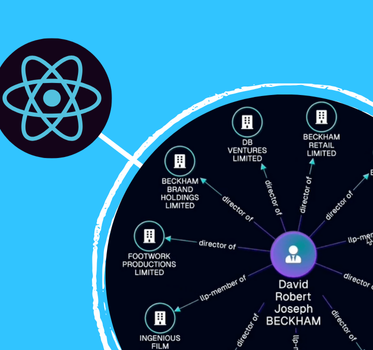
If you’re looking for a graph visualization toolkit, the first question that may come to mind is whether that...
Elevate your graph and timeline data visualization: Smoother, smarter, sharper
Courtney Collins Product Manager
13th May, 2025 | 3 min read
From sleeker animations to richer styling and smoother interactions, these updates help you create visualizations...
5 link visualization styles to showcase relationships
Courtney Collins Product Manager
10th January, 2025 | 6 min read
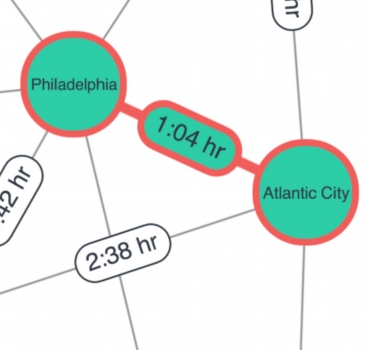
The way you represent relationships between nodes can make or break your link visualization. The link styles you...
Product update: streamline sequential data with new link options
Courtney Collins Product Manager
3rd December, 2024 | 3 min read
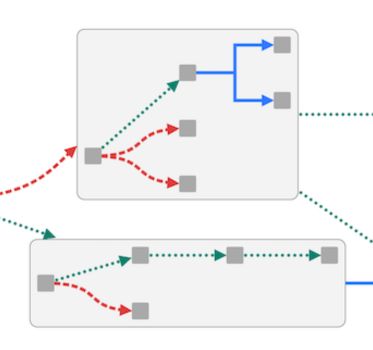
The latest versions of our graph visualization toolkits bring new link options that make it easier than ever to...
Improve your investigation workflow & visualize the data’s narrative
Courtney Collins Product Manager
22nd October, 2024 | 9 min read
At every stage of an investigation workflow, the analysts need to understand the underlying story – or...
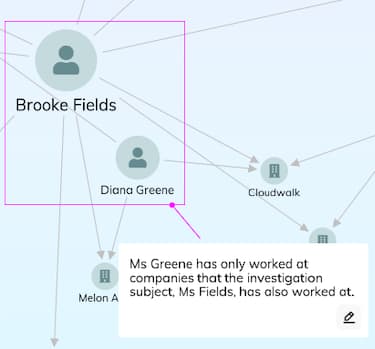
Tell the story of your data with annotations
Courtney Collins Product Manager
15th October, 2024 | 4 min read
Get ready to tell the story of your complex data – our latest major releases mark a big leap forward in the...
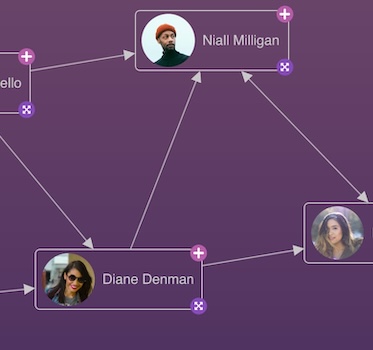
Product update: image labels for unique graph visualizations
Courtney Collins Product Manager
17th July, 2024 | 2 min read
New versions of KeyLines and ReGraph bring more freedom to create custom nodes, greater image & font icon...
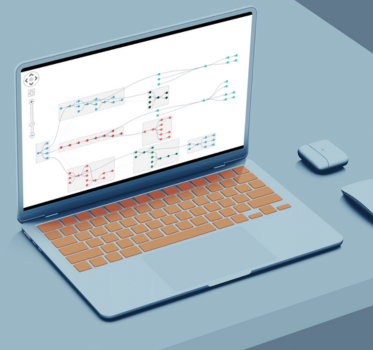
Product update: Smoother and more insightful sequential views
Courtney Collins Product Manager
5th March, 2024 | 2 min read
The latest versions of KeyLines and ReGraph, our graph visualization SDKs, include two hotly-anticipated...
