Geospatial intelligence fusion in a modern defense landscape
Jan Girman Product Manager
4th February, 2026 | 11 min read
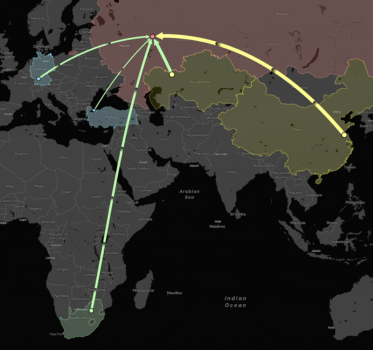
Product manager Jan Girman explores how geospatial fusion is transforming defense and intelligence...
Building an end-to-end supply chain geospatial network analysis demo in MapWeave
Jan Girman Product Manager
10th December, 2025 | 10 min read
Discover how geospatial network analysis eliminates the compromise between strategic and tactical supply chain...
Building an infrastructure network visualization with KronoGraph and MapWeave
Jan Girman Product Manager
12th September, 2025 | 11 min read
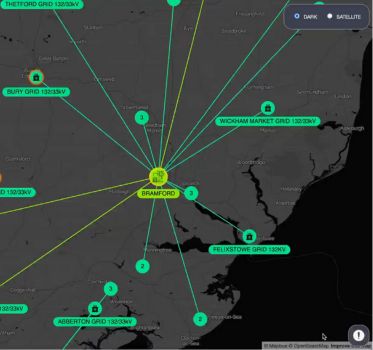
This technical guide to infrastructure network visualization covers timeline and geospatial features, scaling to...
Pattern-of-life analysis for intelligence
Jan Girman Product Manager
5th August, 2025 | 10 min read
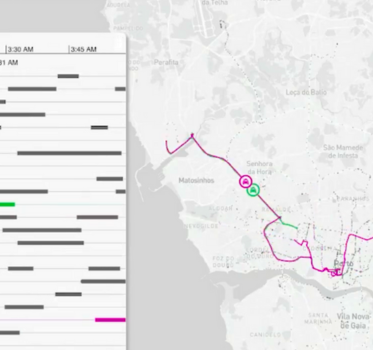
Pattern-of-life analysis reveals habits and behaviors in complex data. See how timeline and geospatial...
Log data visualization for enterprise observability
Jan Girman Product Manager
6th March, 2025 | 7 min read
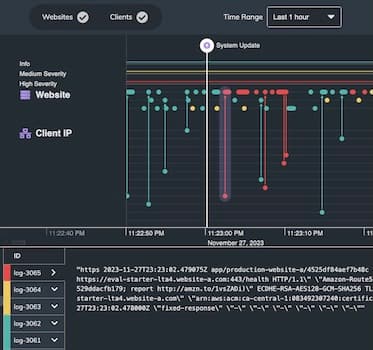
In this blog post, I’ll show how effective log data visualization improves your enterprise observability...
Product update: Event labels to enrich your timeline
Jan Girman Product Manager
23rd January, 2025 | 2 min read
We’ve just released KronoGraph 3.3, with fully customizable labels for event lines, to add clarity to your...
Network digital twin visualization 101
Jan Girman Product Manager
19th November, 2024 | 12 min read
This blog post explores how graph visualization brings digital twins to life. Before joining Cambridge...

