
Network digital twin visualization 101
Jan Girman Product Manager
19th November, 2024 | 12 min read
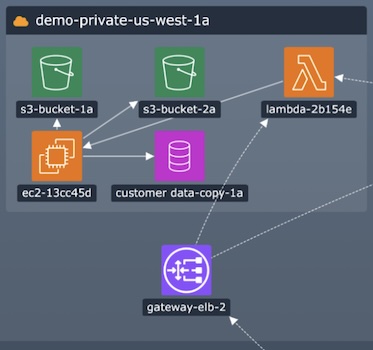
This blog post explores how graph visualization brings digital twins to life. Before joining Cambridge...
Jan Girman Product Manager
19th November, 2024 | 12 min read
This blog post explores how graph visualization brings digital twins to life. Before joining Cambridge...

Courtney Collins Product Manager
22nd October, 2024 | 9 min read
At every stage of an investigation workflow, the analysts need to understand the underlying story – or...
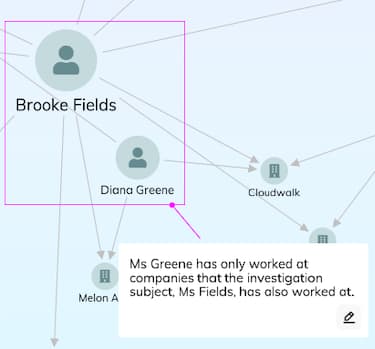
Courtney Collins Product Manager
15th October, 2024 | 4 min read
Get ready to tell the story of your complex data – our latest major releases mark a big leap forward in the...
Bonney O'Hanlon Product Manager
5th September, 2024 | 2 min read
The latest version of KronoGraph, our timeline analytics toolkit, features something unique. For the first time,...
Rosie Griffin HR Advisor
3rd September, 2024 | 5 min read
At Cambridge Intelligence, one of our values is to be “always curious”. We encourage the team to grow their...

Thomas Chan Software Developer
20th August, 2024 | 10 min read
Web developers face a long list of time-consuming challenges. From designing an outstanding UX to building a site...
Dan Williams Chief Product Officer
6th August, 2024 | 8 min read
We look at six key areas of rapid change, and how successful organizations use link analysis techniques to keep...
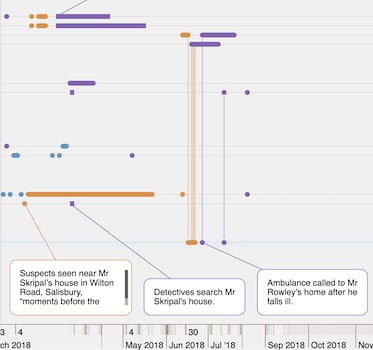
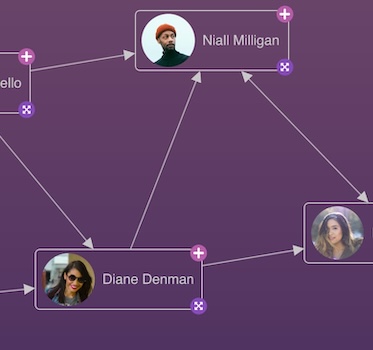
Bonney O'Hanlon Product Manager
23rd July, 2024 | 7 min read
We create a crime data visualization to analyze the people, places and events involved in a real UK Counter...
Courtney Collins Product Manager
17th July, 2024 | 2 min read
New versions of KeyLines and ReGraph bring more freedom to create custom nodes, greater image & font icon...
Registered in England and Wales with Company Number 07625370 | VAT Number 113 1740 61
6-8 Hills Road, Cambridge, CB2 1JP. All material © Cambridge Intelligence .
Privacy Policy | Security Framework
