
Node-and-link applications serve different functions and solve different problems. Some tools are built for diagramming, where users edit and arrange workflows, processes, or visual systems. Others are built for graph visualization and analysis, where users explore connected data, uncover patterns, and understand complex networks. This distinction is important when comparing React Flow and ReGraph.
ReGraph is designed specifically for graph visualization and connected data applications. It combines the flexibility needed to build interactive graph experiences with graph-focused capabilities such as built-in layouts, grouping, temporal exploration, and graph analysis features that help users explore, understand, and gain insight from complex networks.
This makes it particularly well suited to use cases such as attack path visualization, cyber asset visibility, fraud detection, operational intelligence, investigations, and supply chain analysis. As a front-end SDK with minimal external dependencies, it is also well-suited to SaaS, on-premises, and air-gapped deployments where security and deployment flexibility are important considerations.
Like ReGraph, React Flow supports highly customized interactive experiences by allowing users to control node rendering, interaction, and positioning. However, teams building graph analysis applications will often need to supplement the core library with additional graph-specific functionality through third-party libraries and custom implementation.
When building graph visualization applications, the challenge is rarely getting data onto the screen. The real challenge is presenting connected data in a way that remains understandable, performant, and maintainable as the application grows in complexity.
This article focuses on the areas that have the biggest impact on the long-term success of a graph application: Performance, layouts, styling, developer experience, and dependency management. While both React Flow and ReGraph can be used to visualize connected data, their approaches differ significantly in how these capabilities are delivered and maintained.
Graph visualization performance and scalability benchmarks
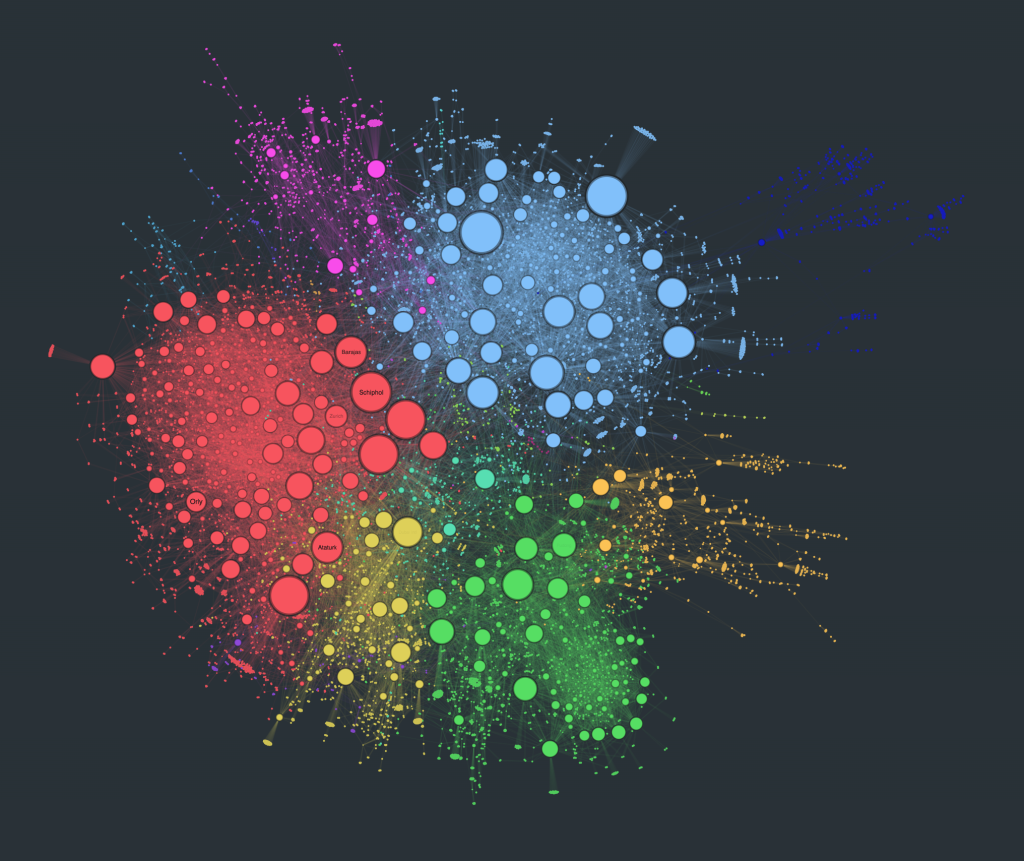
ReGraph’s organic layout with 50,000 items
As datasets and functionality grow more complex, performance becomes a key consideration. Users are no longer simply viewing the presented data – they are exploring relationships, identifying patterns, and following connections within increasingly complex networks in real time.
React Flow performs well for many graph applications and provides guidance on optimising performance as applications scale. For applications with relatively modest graph sizes and interaction complexity, this is unlikely to present a significant challenge. As graph size and complexity increases, however, maintaining responsiveness relies increasingly on application-level optimisation and careful implementation.
Designed specifically for these larger workloads, ReGraph’s rendering architecture takes advantage of GPU acceleration and incremental updates to maintain responsiveness as datasets become larger and more dynamic. As the graph size and interaction complexity increase, the SDK continues to optimise rendering internally, reducing the amount of engineering effort required from the developers. This makes ReGraph particularly well-suited to large scale applications containing tens of thousands of graph items.
Scale, however, is only part of the challenge. Production systems often work with data that is constantly changing. New entities appear, relationships are added or removed, styles are updated, and filters continuously alter what is visible on the screen. Maintaining responsiveness during these operations is just as important as rendering a large graph in the first place.
To understand how ReGraph and React Flow compare under these conditions, consider the following benchmark test:
Performance Metrics (datasets available upon request)
10,000 Items loaded:
| Metric | ReGraph | React Flow (D3|Dagre) | Difference |
|---|---|---|---|
| Render time Organic Layout | 2.12 seconds | 10.35 seconds | 4.88x faster |
| Render time Sequential Layout | 1.92 seconds | 3.76 seconds | 1.96x faster |
| Switching Organic to Sequential | 0.9 seconds | 3.39 seconds | 3.77x faster |
| Switching Sequential to Organic | 1.36 seconds | 10.85 seconds | 7.98x faster |
| Pan/Zoom Organic Layout | 120+ Fps | 10 Fps | N/A |
| Pan/Zoom Sequential Layout | 120+ Fps | 13Fps | N/A |
20,000 Items loaded:
| Metric | ReGraph | React Flow (D3|Dagre) | Difference |
|---|---|---|---|
| Render time Organic Layout | 3.63 seconds | 24.25 seconds | 6.68x faster |
| Render time Sequential Layout | 3.93 seconds | 11.46 seconds | 2.92x faster |
| Switching Organic to Sequential | 1.79 seconds | 9.62 seconds | 5.37x faster |
| Switching Sequential to Organic | 2.17 seconds | 24.97 seconds | 11.51x faster |
| Pan/Zoom Organic Layout | 85 Fps | 5 Fps | N/A |
| Pan/Zoom Sequential Layout | 75 Fps | 5 Fps | N/A |
50,000 Items loaded:
| Metric | ReGraph | React Flow (D3|Dagre) | Difference |
|---|---|---|---|
| Render time Organic Layout | 12.47 seconds | 75.1 seconds | 6.02x faster |
| Render time Sequential Layout | 12.97 seconds | 53.05 seconds | 4.09x faster |
| Switching Organic to Sequential | 6.29 seconds | 43.57 seconds | 6.93x faster |
| Switching Sequential to Organic | 5.19 seconds | 81.69 seconds | 15.74x faster |
| Pan/Zoom Organic Layout | 39 Fps | 1 Fps | N/A |
| Pan/Zoom Sequential Layout | 39 Fps | 1 Fps | N/A |
Across the benchmark scenarios, ReGraph consistently demonstrates faster rendering, quicker layout transitions, and significantly higher frame rates during interaction. The difference becomes particularly noticeable as dataset size increases, highlighting the benefit of a toolkit designed specifically for a connected data visualization, rather than adapted for it.
Built-in graph layout algorithms vs third-party integrations
ReGraph’s organic layout switching to a sequential layout and back again.
In graph visualization, layouts do far more than determine where nodes appear on a screen. A good layout helps a user identify groups, understand relationships, follow paths through the data, and uncover insights that would otherwise be difficult to see.
ReGraph includes graph-focused layouts within the SDK, allowing developers to switch between different layout algorithms via a simple API call. This doesn’t require any additional libraries, custom integration work, or knowledge of layout algorithms. These layouts have been refined across a wide range of connected data applications and continue to evolve alongside the SDK itself.
ReGraph’s built-in layouts are designed specifically for graph visualization, and connected data exploration, with a range of layout algorithms available to suit different use cases. For example, the Organic layout helps reveal natural groups and relationships within a complex network, making it well suited to investigations and exploratory analysis. The Sequential layout arranges data into a clear tree structure, which is great for representing hierarchies or directional relationships. These are just two examples of the layouts available in ReGraph, each designed to help users understand connected data rather than simply positioning nodes on a canvas.
Importantly, ReGraph still provides full control over node positions when required. Developers can specify x and y coordinates directly, allowing applications to combine predefined layout positions with custom positioning logic when needed.
React Flow provides complete control over node positioning but does not include graph layout algorithms as part of its core library. When automatic layouts are required, developers will typically integrate third-party libraries such as Dagre, ELK, or D3 and write additional code needed to transform graph data into the format expected by those libraries. For teams building graph visualization applications, this means time selecting, learning, integrating, and maintaining external layout libraries alongside the application itself.
ReGraph removes much of this complexity by providing graph-focused layouts as part of the SDK, allowing developers to spend less time wrestling the layout and more time delivering features that add value to their users.
Graph styling and advanced interaction techniques
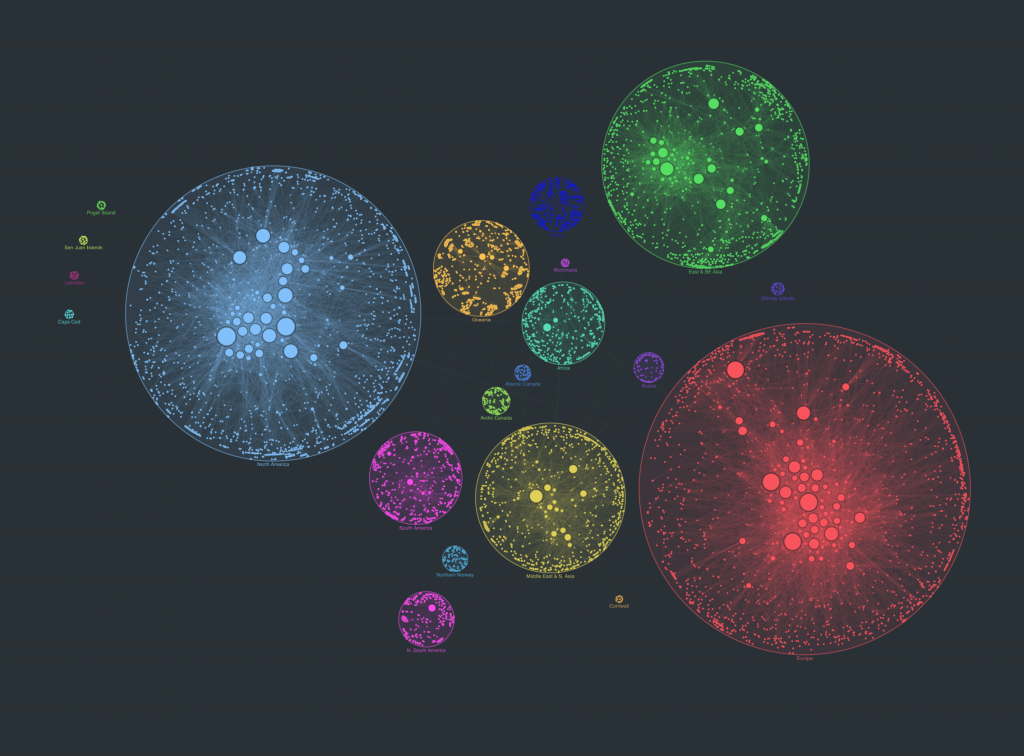
ReGraph’s organic layout with combos – 50,000 items
In graph visualization applications, styling is about far more than just the visual appearance. Color, grouping, and interactions all play an important role in understanding connected data, and quickly identifying the relationships that matter most.
ReGraph provides extensive styling capabilities that are designed specifically for graph visualization. Developers can customise the appearance and behaviour of nodes, links, labels, groups, and interactions while taking advantage of the graph aware features that help preserve context as datasets become larger and more complex. Furthermore, ReGraph can also be integrated with modern front-end frameworks, such as Tailwind.
Features such as halos, neighbor highlighting, and summary links between groups make it easier for users to focus on relevant entities and understand how they relate to a wider network. Combined with ReGraph’s built-in layouts, these capabilities help transform styling from a purely visual change into a tool for improving analysis and exploration.
React Flow also provides a high degree of visual flexibility and integrates naturally with a modern React environment. However, graph specific visualization techniques and interaction patterns typically need to be implemented by the development team rather than being provided as part of the core library.
Beyond the SDK itself, ReGraph is supported by a broader ecosystem of styling examples, implementation guidance, and a dedicated Figma design kit which helps teams move more quickly from concept to implementation. These resources make it easier to create graph visualizations that are both visually consistent and effective at communicating connected data within large graphs.
AI-assisted development: dedicated MCP servers vs community knowledge
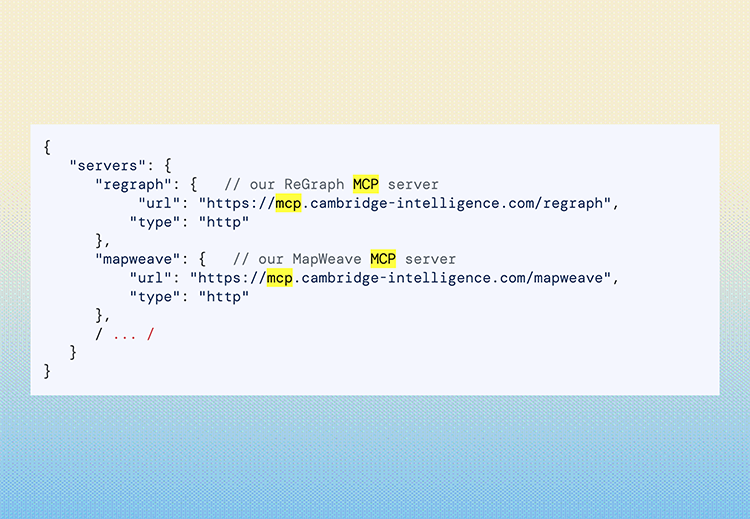
ReGraph MCP server enables AI agents to access APIs and docs and provides more accurate and relevant help when developing with ReGraph.
AI-assisted development is becoming an increasingly important part of modern engineering workflows, and both ReGraph and React Flow can benefit from modern coding assistants.
ReGraph supports these workflows through its dedicated MCP (Model Context Protocol) server, giving AI assistants direct access to ReGraph-specific documentation, APIs, examples, and implementation guidance. Because the MCP server is maintained alongside the product and updated with each release, AI-generated guidance can remain aligned with the latest version of the SDK rather than relying on historical training data.
React Flow benefits from being a widely adopted open-source library with a large ecosystem of community tutorials, examples, and discussions that AI assistants can also draw upon. As with any public information sources, the quality and freshness of the generated responses ultimately depends on the information available to the model.
For teams building graph visualizations, ReGraph’s MCP approach provides an additional layer of confidence that AI-generated guidance reflects the current capabilities and APIs of the SDK.
Developer support: expert guidance vs capped support plans
Building a successful graph visualization application involves more than choosing the right SDK. It also requires access to the documentation, examples, tooling, and expertise needed to move efficiently from concept to production.
ReGraph combines the SDK with a broader development ecosystem designed to support that process. Developers have access to extensive coded examples, implementation guidance, and the aforementioned Figma design kit that helps bridge the gap between designers and developers.
ReGraph customers also receive direct, unlimited access to the Engineers who build and maintain ReGraph. From best practices, to tailored workshops for their specific use case. Organisations can take advantage of these tailored workshops and deep dive sessions to accelerate delivery and help teams get the most from the toolkit.
React Flow is available as an open-source library, with optional paid plans (React Flow Pro) that provide additional examples, templates, and advanced resources. At the time of writing, the professional plan includes up to one hour of individual email support per month, while the Enterprise plan includes one hour of individual support by voice, video, or email per month. While this level of support may be suitable for established products, developers will often far exceed this 1 hour threshold when building an application from scratch – especially if specific expertise or advice on best practices are required.
When teams build graph visualization applications, the difference clearly extends beyond the features list. It is the difference between relying primarily on documentation and limited support, or continued access to specialists that provide guidance and assistance throughout the lifetime of a product.
Dependency management, security, and enterprise compliance
ReGraph is developed and supported under Cambridge Intelligence’s ISO 27001-certified Security Framework
Often overlooked, dependencies cause significant impact on the long-term cost and complexity of a project. Every additional library introduces another layer that must be evaluated, integrated, maintained, updated, and, in many organisations, reviewed from a security and governance perspective.
ReGraph is designed to minimize this by including core graph visualization capabilities as part of the SDK itself. Built-in layouts, graph interactions, styling, and other graph focused functionality are available without requiring additional graph specific dependencies. Beyond React and lodash, no additional libraries are required to access these capabilities.
React Flow takes a different approach as developers assemble the functionality they need from a combination of libraries. For example, applications requiring automatic layouts will commonly integrate third party libraries such as Dagre, ELK, or D3-based layout engines. While this provides flexibility, it also means evaluating additional APIs, managing separate release cycles, monitoring security updates, and maintaining those integrations over time.
For organizations operating in security-conscious or highly regulated environments, these considerations become much more important. Every dependency may need to pass an internal review process, vulnerability scanning, licence checks, etc, before it can be approved for use. Reducing the number of dependencies therefore not only simplifies development, but also compliance and long-term maintenance.
Deployment requirements can also influence the decision. ReGraph’s front-end architecture and minimal dependency footprint make it well-suited to SaaS, on-premises, and air gapped deployments where organisations need to retain full control over their software stack and deployment environment without relying on external sources.
Final verdict: diagramming tools vs complex graph analysis
React Flow and ReGraph are both capable React libraries, but they are designed to solve different problems.
React Flow provides a flexible foundation that can be adapted to build a wide variety of node-based applications and is particularly well suited to diagramming applications, where users create or arrange the structure themselves. It can be used to build graph visualizations, but developers will typically need to supplement the core library with additional graph-specific functionality through third-party libraries and custom implementation.
ReGraph supports these same interactive experiences while extending them with built-in layouts, graph analysis features, and graph aware tooling designed specifically for connected data applications. Rather than adapting a diagramming toolkit for graph analysis, ReGraph provides the graph specific capabilities needed for large-scale graph visualization out of the box.
When comparing ReGraph and React Flow, the differences become increasingly apparent as projects grow in scale and complexity. Performance at large dataset sizes, integrated layout capabilities, dependency management, deployment flexibility, and access to graph visualization expertise all contribute to a platform that is purpose-built for graph analysis rather than adapted for it.
If your goal is to build a diagramming application, React Flow is an excellent choice. If your goal is to build a graph visualization or graph analysis application, ReGraph provides the performance, scalability, and purpose-built capabilities needed to build large-scale connected data applications faster.
Ready to visualize your connected data?
Bring clarity, confidence and interactive intelligence to your product – with visualizations that transform how users understand and explore complex data.
Share: