The benefits of a graph visualization application
Andrew Disney Marketing Director
18th May, 2018 | 4 min read
Discover the benefits of graph visualization and why it should be a core part of your web application – it’s...
Andrew Disney Marketing Director
18th May, 2018 | 4 min read
Discover the benefits of graph visualization and why it should be a core part of your web application – it’s...

Dan Williams Chief Product Officer
9th February, 2018 | 6 min read
In this blog post we explore open source code libraries versus commercial SDKs to show why Cambridge...
Andrew Disney Marketing Director
30th January, 2017 | 5 min read
Font icons are web font files made up of symbols and icons. Learn how to use them in your KeyLines graph...

Andrew Disney Marketing Director
3rd January, 2017 | 2 min read
In this FAQ blog post, we’ll take a closer look at the KeyLines Graph Engine to understand what it is and how it...
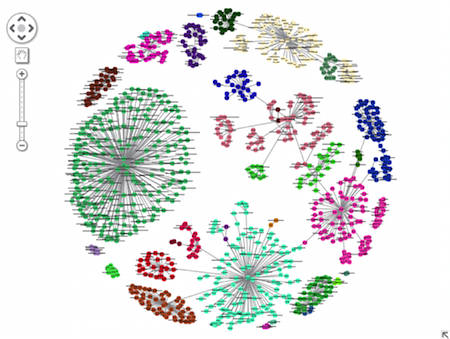
Andrew Disney Marketing Director
11th January, 2016 | 3 min read
Our clustering function can identify communities in your networks. It has been carefully optimized to balance...
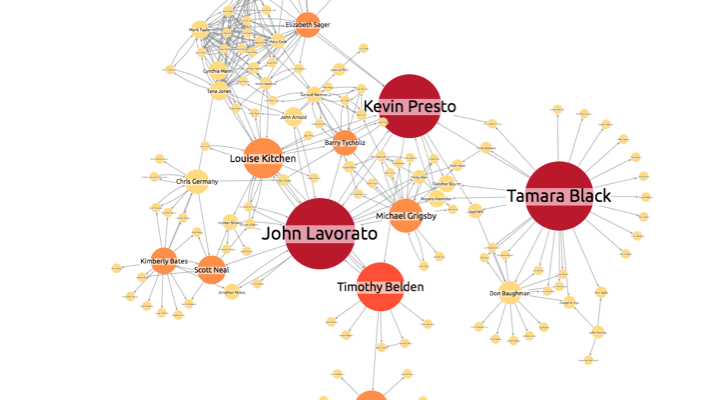
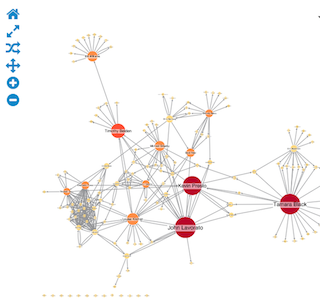
Andrew Disney Marketing Director
21st July, 2015 | 6 min read
Using network visualization and SNA measures, our intern plays detective and dissects the connections in the Enron...
Registered in England and Wales with Company Number 07625370 | VAT Number 113 1740 61
6-8 Hills Road, Cambridge, CB2 1JP. All material © Cambridge Intelligence .
Privacy Policy | Security Framework
