Designing simple visual models that users love
Kevin Naughten Senior Product Manager
15th July, 2019 | 6 min read
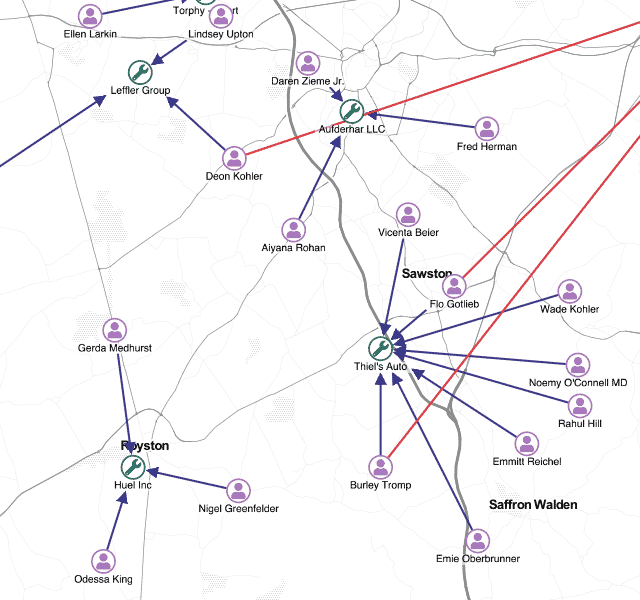
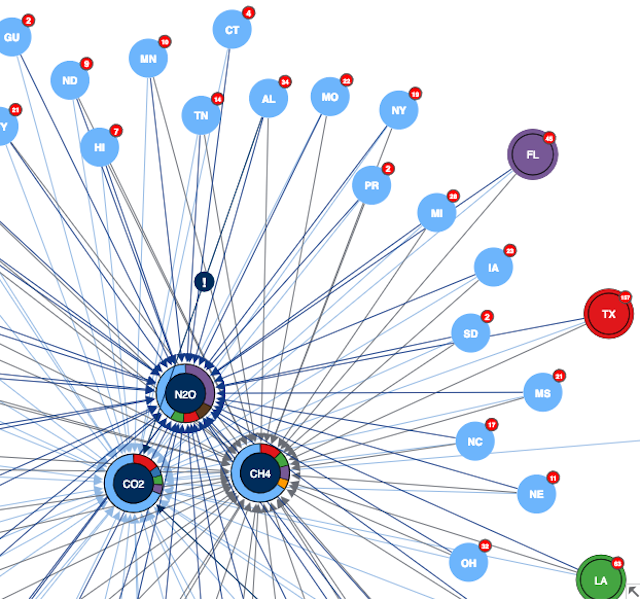
Let’s create visual models that deliver the best user experience (UX). Detailed graph visualizations from an...
Kevin Naughten Senior Product Manager
15th July, 2019 | 6 min read
Let’s create visual models that deliver the best user experience (UX). Detailed graph visualizations from an...
Dan Williams Chief Product Officer
17th June, 2019 | 5 min read
How to build great graph visualization tools that fit seamlessly inside your existing applications, matching...
Andrew Disney Marketing Director
20th May, 2019 | 5 min read
Let’s focus on WebGL – what it is, how it works, and why performance is a key contributor to one of...
Dan Williams Chief Product Officer
8th April, 2019 | 4 min read
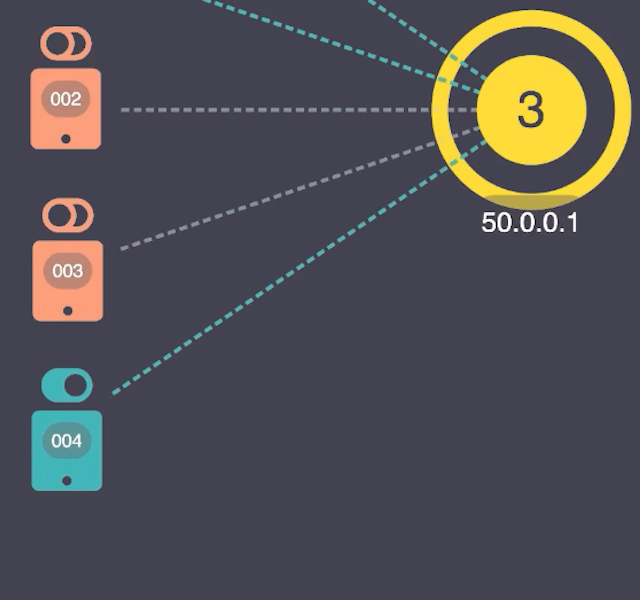
This blog shows five of our favorite uses for glyphs to help breathe new life into your network visualization...
Gizem Unal Head of Marketing
2nd April, 2019 | 8 min read
In this blog post, a first-time KeyLines user describes their experience of using the graph visualization toolkit...
Christian Miles VP of Sales
18th March, 2019 | 7 min read
There are so many visualization options to choose from. In this post, we examine the pros and cons of one popular...
Dan Williams Chief Product Officer
18th February, 2019 | 5 min read
Combos are great for reducing clutter and organizing your networks into something more manageable. This blog...
Thomas Chan Software Developer
12th February, 2019 | 7 min read
Learn how to integrate KeyLines with Esri’s open source esri-leaflet library to access their ArcGIS mapping...
Catherine Kearns Content Strategist & Team Lead
14th January, 2019 | 6 min read
In this blog post, we’ll bring a medieval community to life. Our graph visualizations will help us gain insight...
Registered in England and Wales with Company Number 07625370 | VAT Number 113 1740 61
6-8 Hills Road, Cambridge, CB2 1JP. All material © Cambridge Intelligence .
Privacy Policy | Security Framework
