Six essential cyber security analysis tools
Dan Williams Chief Product Officer
11th August, 2020 | 8 min read
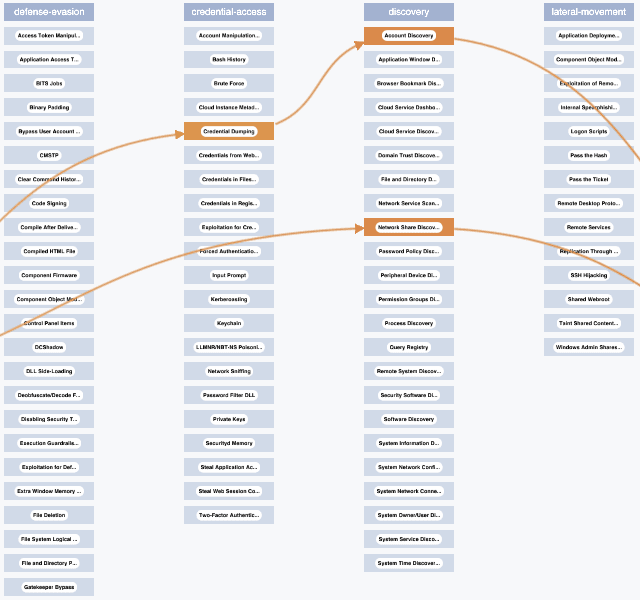
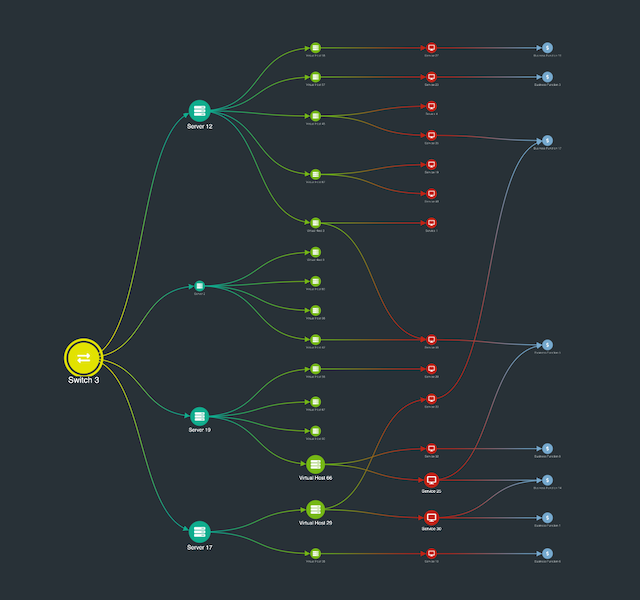
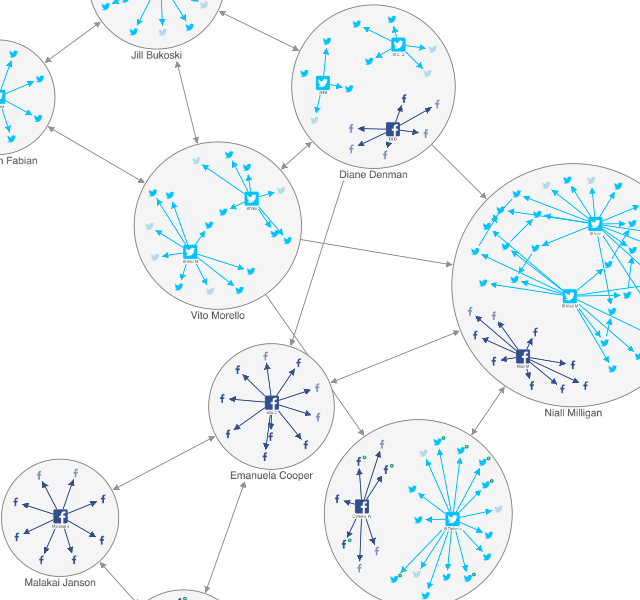
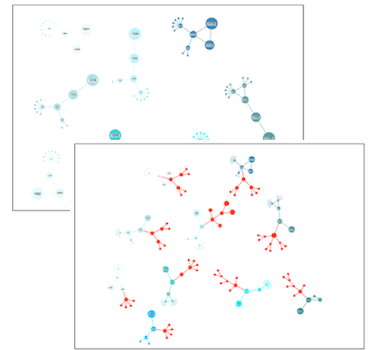
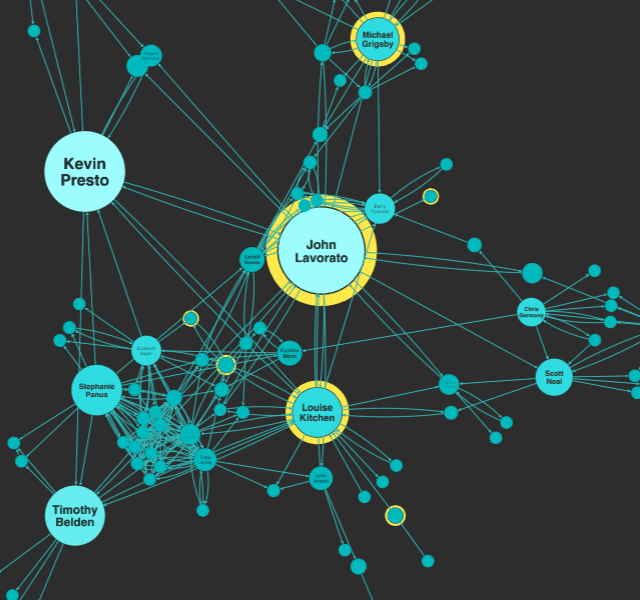
With examples from the cyber security world, this blog focuses on six clever customization options in KeyLines and...
Dan Williams Chief Product Officer
11th August, 2020 | 8 min read
With examples from the cyber security world, this blog focuses on six clever customization options in KeyLines and...
Dan Williams Chief Product Officer
22nd July, 2020 | 3 min read
We’re excited to release KeyLines 6.0 – the latest major version of our graph visualization toolkit for...
Catherine Kearns Content Strategist & Team Lead
15th June, 2020 | 6 min read
There’s a growing need for apps that design the best strategic collaborations, bringing together the right...
Roger Murby Software Test Engineer
25th May, 2020 | 6 min read
In this blog post, Roger Murby tells us what life’s like as a software test engineer here, and explains how he...
Christian Miles VP of Sales
17th February, 2020 | 7 min read
This step-by-step developer tutorial describes how to integrate KeyLines with Amazon Neptune using AWS...
Christian Miles VP of Sales
3rd February, 2020 | 10 min read
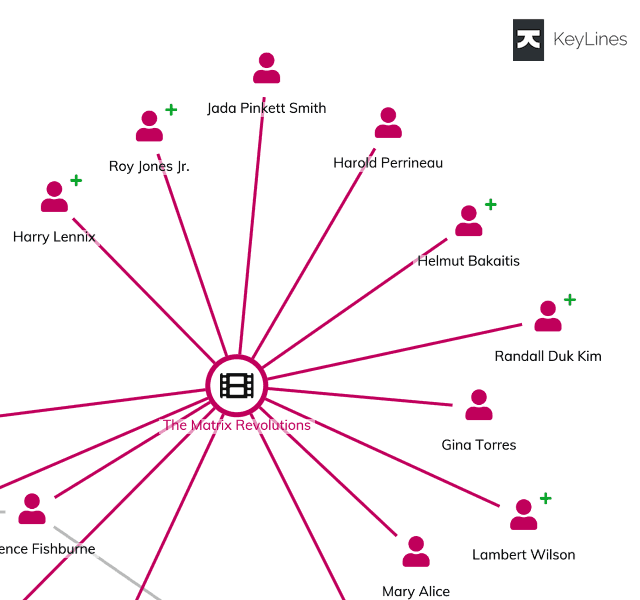
In this developer tutorial, we’ll use SPARQL to query a DBpedia knowledge graph visualization of connections...
Corey Lanum Chief Product Evangelist
23rd January, 2020 | 7 min read
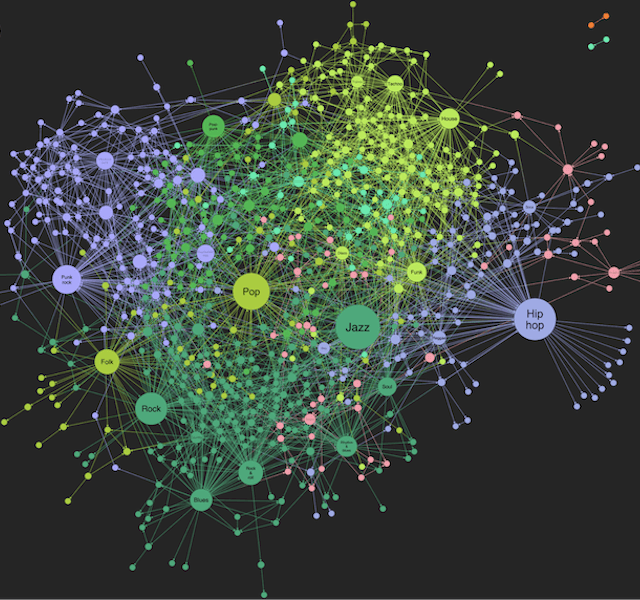
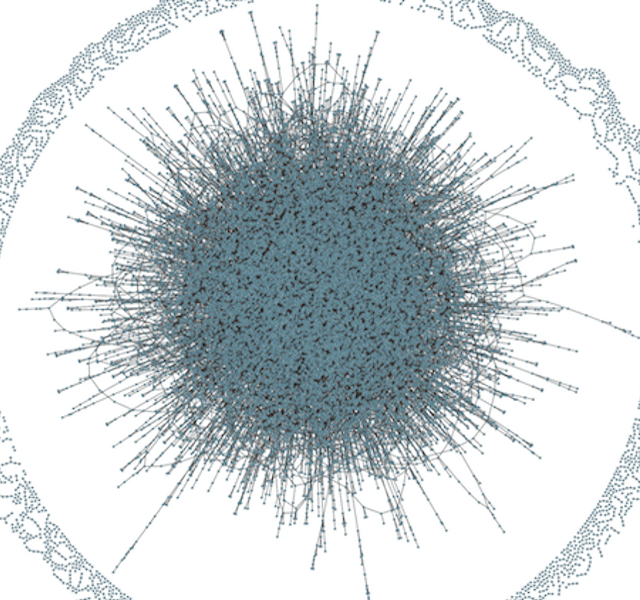
Successful graph visualization at scale: proven strategies to visualize your graph data at scale and still uncover...
Andrew Disney Marketing Director
14th January, 2020 | 5 min read
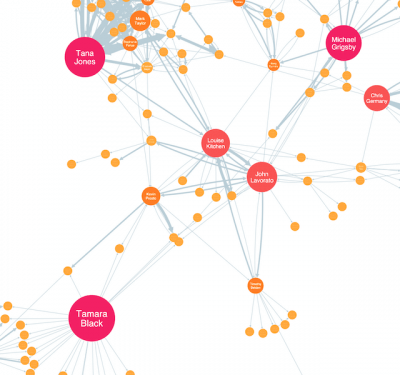
PageRank centrality & EigenCentrality are powerful graph functions in our visualization technology. Discover...
Andrew Disney Marketing Director
2nd January, 2020 | 5 min read
Here’s everything you need to get started with centrality measures: what they are, what they tell us and...
Registered in England and Wales with Company Number 07625370 | VAT Number 113 1740 61
6-8 Hills Road, Cambridge, CB2 1JP. All material © Cambridge Intelligence .
Privacy Policy | Security Framework
