Enhance your dashboard design with data visualization
Christian Miles VP of Sales
6th July, 2021 | 8 min read
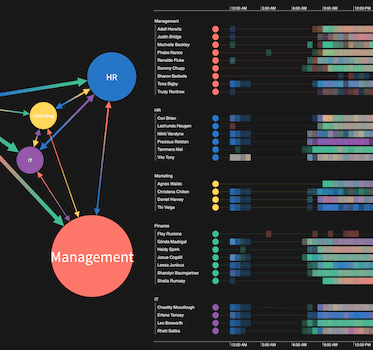
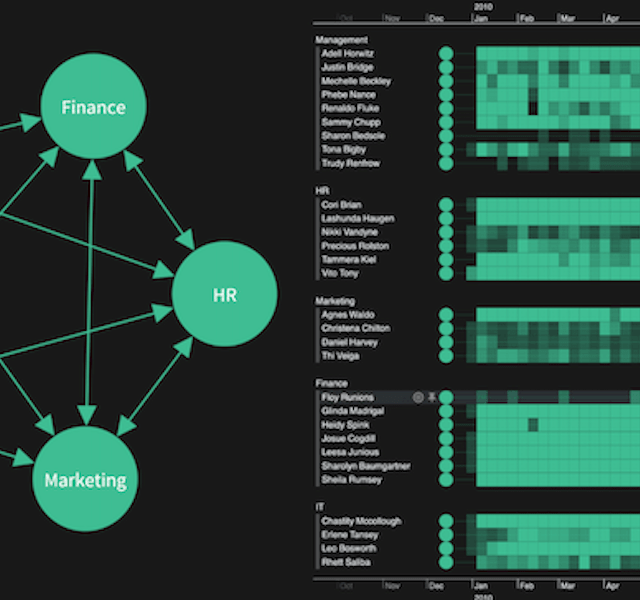
Let’s make our visual network analysis tool for dashboards even better! In pt2 of this series, we use...
Christian Miles VP of Sales
6th July, 2021 | 8 min read
Let’s make our visual network analysis tool for dashboards even better! In pt2 of this series, we use...
Catherine Kearns Content Strategist & Team Lead
29th June, 2021 | 8 min read
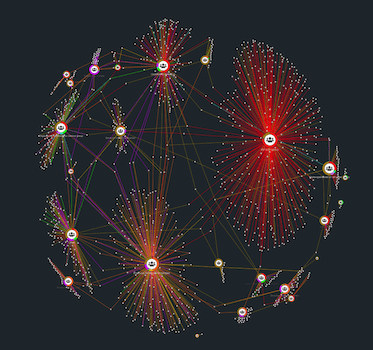
Your essential guide to graph analytics: what they are, why they’re important, and how they provide a deeper...
Christian Miles VP of Sales
22nd June, 2021 | 8 min read
Let’s explore how visual network analysis tools complement dashboards, adding context, interactivity and...
Kevin Naughten Senior Product Manager
15th June, 2021 | 8 min read
Interactive graph visualization just got easier! These 4 examples show how to customize hover and select behavior...
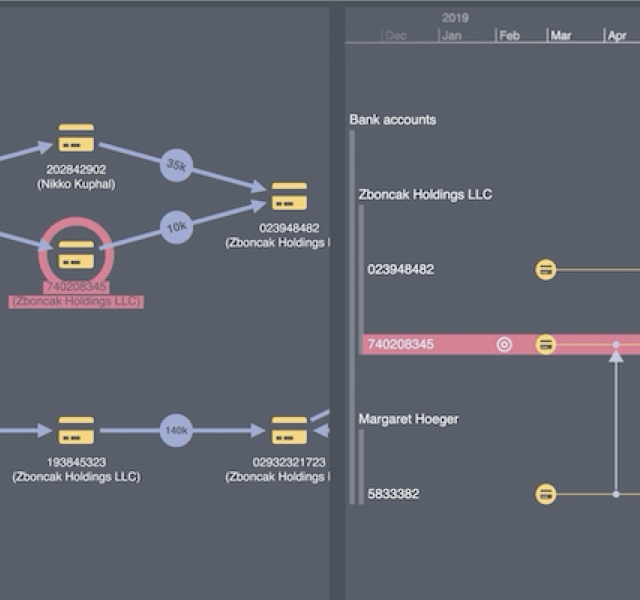
Dan Williams Chief Product Officer
1st June, 2021 | 8 min read
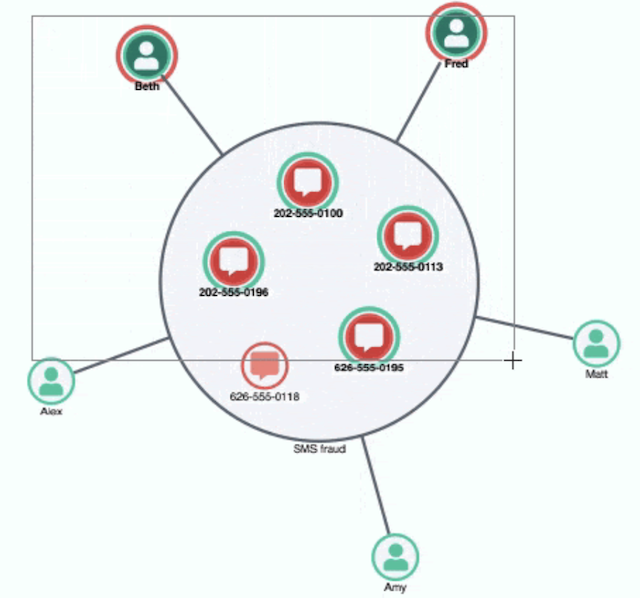
Discover how we use KeyLines & KronoGraph to create flow analysis apps essential for investigating financial...
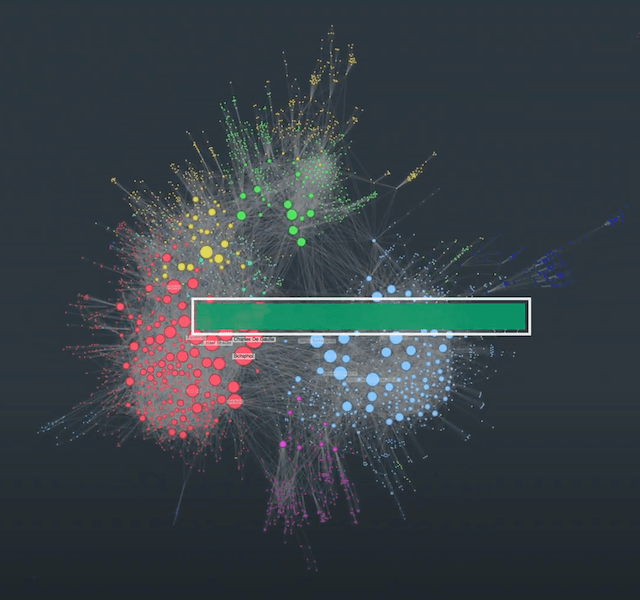
Catherine Kearns Content Strategist & Team Lead
5th May, 2021 | 5 min read
Discover what makes the updated organic layout in our KeyLines and ReGraph toolkits the most powerful, high...
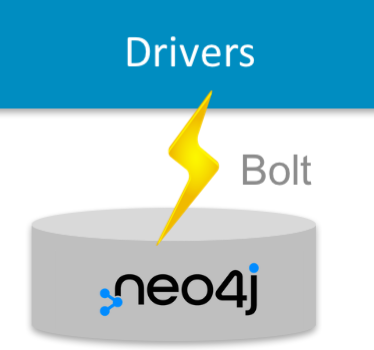
Sonali Singh Solutions Engineer
27th April, 2021 | 8 min read
Learn how to use the Neo4j Bolt Protocol to visualize Neo4j graph databases with the KeyLines graph visualization...
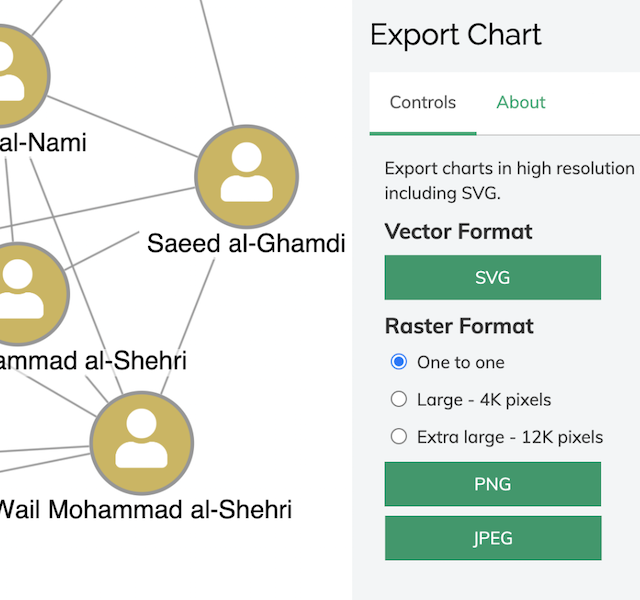
Catherine Kearns Content Strategist & Team Lead
16th March, 2021 | 3 min read
Learn how KeyLines delivers ultra high-resolution chart export (16K) to PNG & JPEG – plus support for...
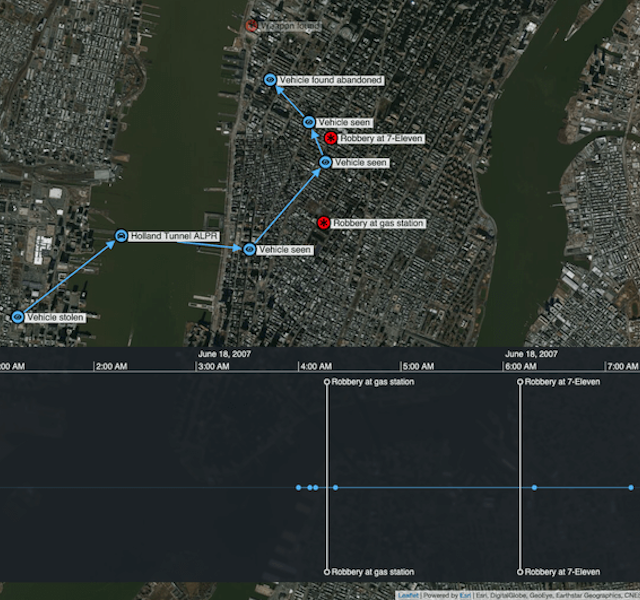
Andrew Disney Marketing Director
23rd February, 2021 | 4 min read
To build a criminal case, investigators collate information from all sources, revealing an accurate and compelling...
Registered in England and Wales with Company Number 07625370 | VAT Number 113 1740 61
6-8 Hills Road, Cambridge, CB2 1JP. All material © Cambridge Intelligence .
Privacy Policy | Security Framework
