
Product updates: extend your graph visualization app
Catherine Kearns Content Strategist & Team Lead
1st November, 2022 | 2 min read
The latest updates to our graph visualization toolkits bring KronoGraph 2.0’s exciting new features to our...
Catherine Kearns Content Strategist & Team Lead
1st November, 2022 | 2 min read
The latest updates to our graph visualization toolkits bring KronoGraph 2.0’s exciting new features to our...
Kevin Naughten Senior Product Manager
27th September, 2022 | 2 min read
The latest releases of our graph visualization SDKs bring more control over combos, and a live coding environment...
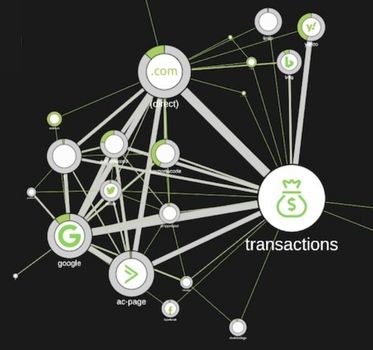
Rosy Hunt Content Marketing Specialist
30th August, 2022 | 7 min read
In marketing, ‘attribution’ can be a dirty word. It’s all about tracking human behavior, and using that data...
Corey Lanum Chief Product Evangelist
2nd August, 2022 | 13 min read
In this technical blog post, I show you how to get KeyLines, our JavaScript toolkit for graph visualization,...
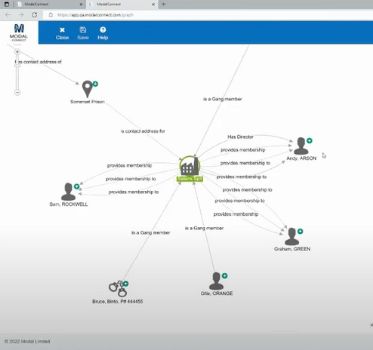
Rosy Hunt Content Marketing Specialist
19th July, 2022 | 6 min read
Find out how ModalConnect use our graph visualization technology to power the advanced visual analytics in their...
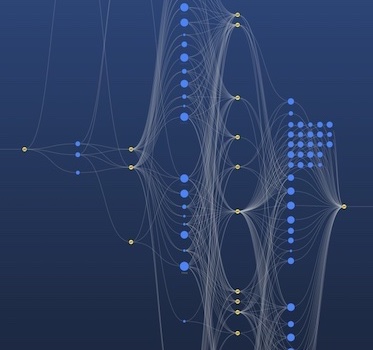
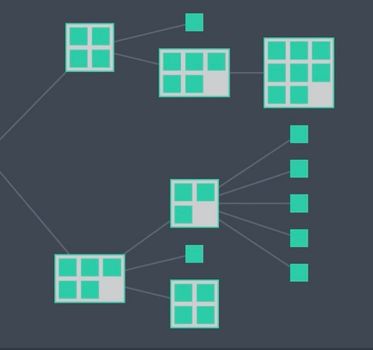
Julia Robson Principal Team Lead
15th June, 2022 | 6 min read
Sequential layout is the best choice for tiered data containing distinct levels of nodes. Find out what makes it...

Dan Williams Chief Product Officer
31st May, 2022 | 2 min read
The latest updates to our graph visualization toolkits include new testing APIs and a live-coding...
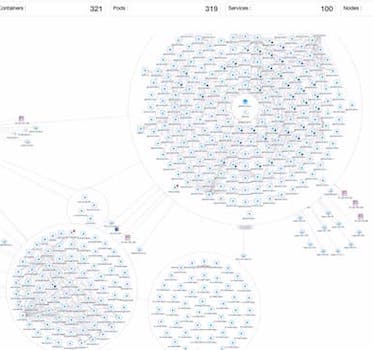
Andrew Disney Marketing Director
19th May, 2022 | 6 min read
In this blog post, we see how Virtana OpsCruise – a leading modern applications observability platform and...

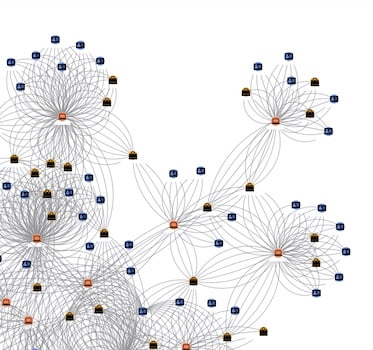
Dan Williams Chief Product Officer
5th April, 2022 | 9 min read
Large network visualization is no problem for our toolkits! We used two of our favorite layouts to map out a...
Registered in England and Wales with Company Number 07625370 | VAT Number 113 1740 61
6-8 Hills Road, Cambridge, CB2 1JP. All material © Cambridge Intelligence .
Privacy Policy | Security Framework
