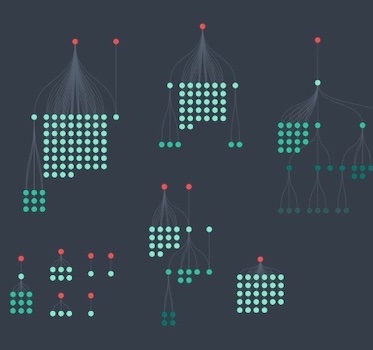
Product updates: stacking and sorting sequential layouts
Dan Williams Chief Product Officer
15th March, 2022 | 2 min read
By popular demand, KeyLines 6.9 and ReGraph 3.6, our graph visualization toolkits, give you even more control over...
Dan Williams Chief Product Officer
15th March, 2022 | 2 min read
By popular demand, KeyLines 6.9 and ReGraph 3.6, our graph visualization toolkits, give you even more control over...
Dan Williams Chief Product Officer
1st March, 2022 | 9 min read
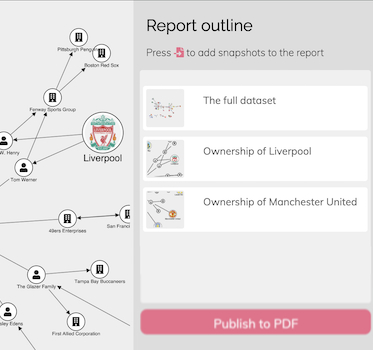
We use our graph visualization toolkits to publish a PDF report based on multiple snapshots of interactive graph...
Thomas Chan Software Developer
11th February, 2022 | 5 min read
Find out how quick and easy it is to integrate Angular with KeyLines, our graph visualization toolkit for...
Phil Rodgers Principal Team Lead
8th February, 2022 | 3 min read
We’ve used KeyLines, our graph visualization toolkit, to reveal the word that gives you the best tactical...
Dan Williams Chief Product Officer
7th December, 2021 | 2 min read
Serious improvements to KeyLines & ReGraph layout performance, plus a playground & localization support...
Dan Williams Chief Product Officer
31st August, 2021 | 3 min read
Find out what’s new in our latest KeyLines & ReGraph releases. Highlights include improved rectangular...
Dan Williams Chief Product Officer
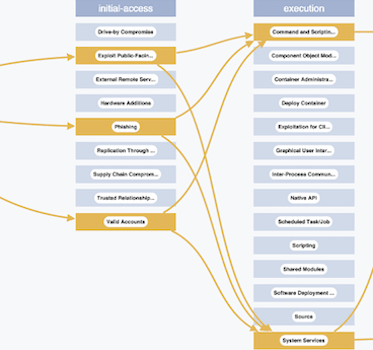
24th August, 2021 | 7 min read
I’ll demonstrate how adding the MITRE ATT&CK framework to your data visualizations can power your...
Khadeja Sajjad Software Developer
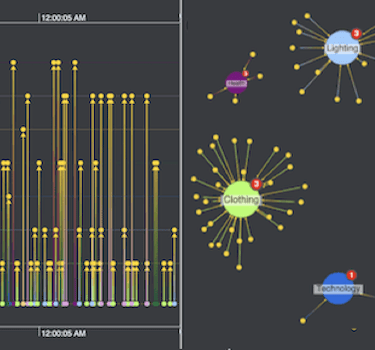
17th August, 2021 | 10 min read
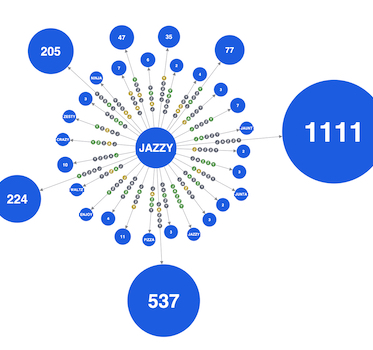
In this post, I’ll aim to spot fake Amazon reviews using the powerful graph and timeline data visualization...
Dan Williams Chief Product Officer
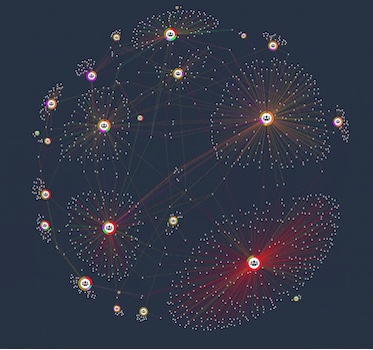
27th July, 2021 | 9 min read
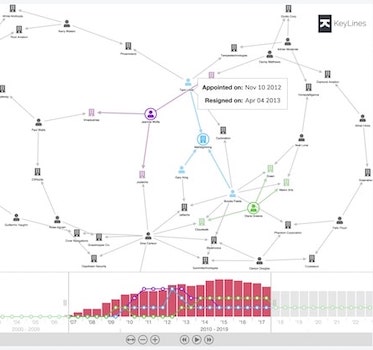
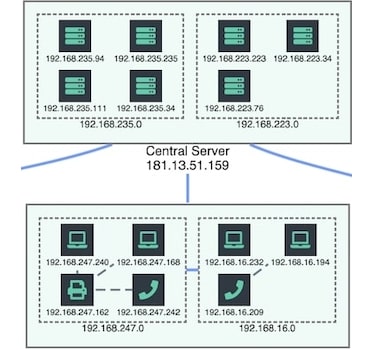
Find out how to use network visualization and forensic timeline analysis to make sense of complex, high-velocity...
Registered in England and Wales with Company Number 07625370 | VAT Number 113 1740 61
6-8 Hills Road, Cambridge, CB2 1JP. All material © Cambridge Intelligence .
Privacy Policy | Security Framework
