You need the right tools to successfully tackle the complex challenge of regulatory compliance. That toolset has compliance data visualization at its core.
To manage and prove compliance with relevant laws, regulations and standards, organizations must collect and analyze data – and the connections inside it – at scale.
Well-documented compliance processes aren’t enough. Over time, regulations increase in range and complexity, organizational data grows larger and more siloed, and quality compliance management becomes harder to achieve. As a result, compliance is seen as a costly, time-consuming burden.
Organizations turn to compliance data visualization to overcome these and other challenges. Let’s see why.
Compliance data visualization and AI
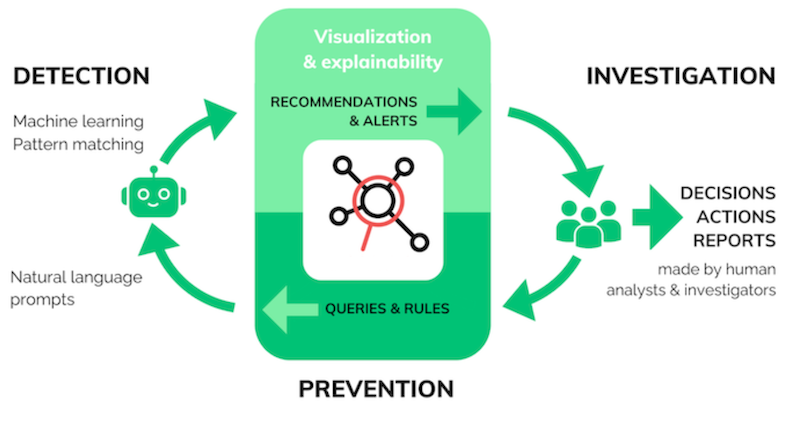
AI is revolutionizing how organizations manage compliance and risk.
Automated auditing, anomaly detection, risk scoring and reporting saves time. It frees compliance managers to take a more strategic role – designing more robust processes or preparing for new regulations. But the case for human oversight is strong.
AI tools are prone to bias and hallucinations. They need careful training – especially when requirements or scenarios change.
Their decision-making processes can be opaque to teams who need to explain recommendations to customers and stakeholders, or document them for regulators and certification bodies.
Without a clear understanding of the logic behind automated recommendations, teams don’t have the decision intelligence they need to take action, suggest process improvements or remove vulnerabilities.
The data visualization-AI intelligence cycle is designed to overcome that gap, combining the strengths of human analysts, AI technologies and powerful data visualization.
Compliance data visualization for financial crime
Financial services organizations operate within a complex set of laws and regulations across national and international jurisdictions.
Organizations perform extensive due diligence on high-risk customers and transactions to prevent the misuse of their services, and comply with anti-money laundering (AML) and countering the finance of terrorism (CFT) regulations.
That could mean checking relationships with politically exposed persons (PEPs), investigating transactions above certain thresholds, monitoring accounts against sanctions lists, or identifying the ultimate beneficial owners of a business.
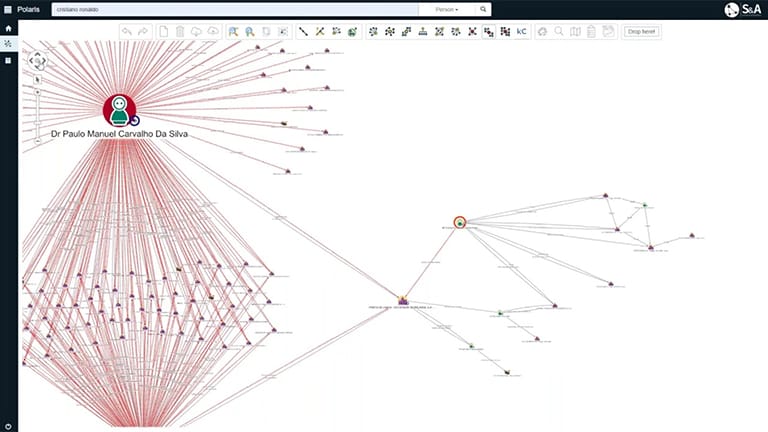
In all these cases, graph visualization techniques untangle complex relationships so analysts can rapidly uncover the insights they need.
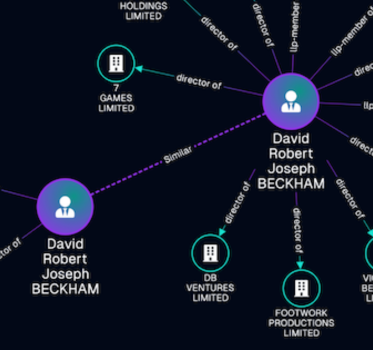
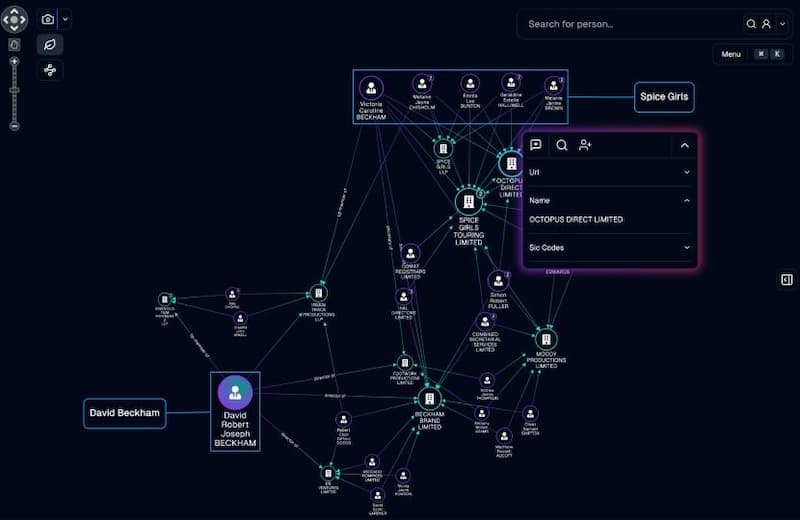
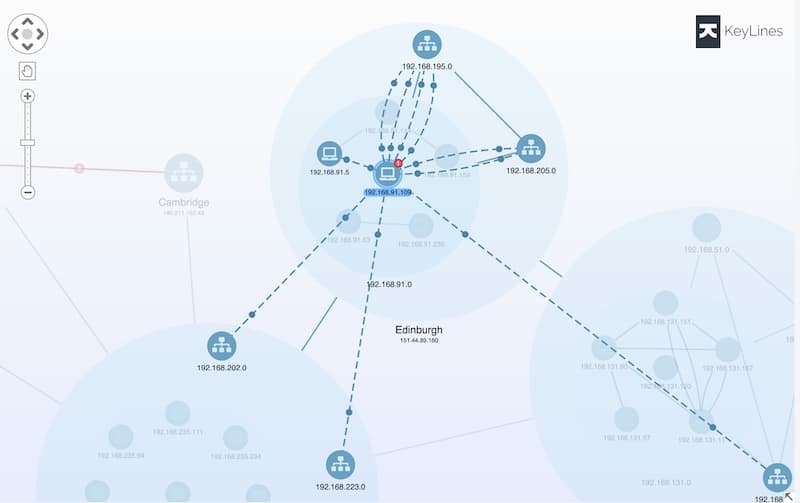
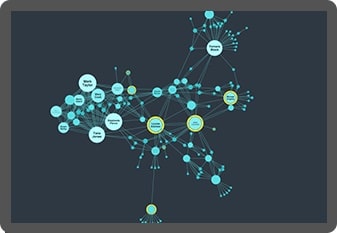
It’s a challenge for any KYC investigation to manage complex high-volume data from multiple open (OSINT) and proprietary sources.
Link analysis overcomes data silos to present information from many sources in an intuitive and interactive view that human analysts can understand.
Here, we see information from Companies House (the UK’s register of companies) combined with LinkedIn data.
Read more about visualizing OSINT for due diligence investigations
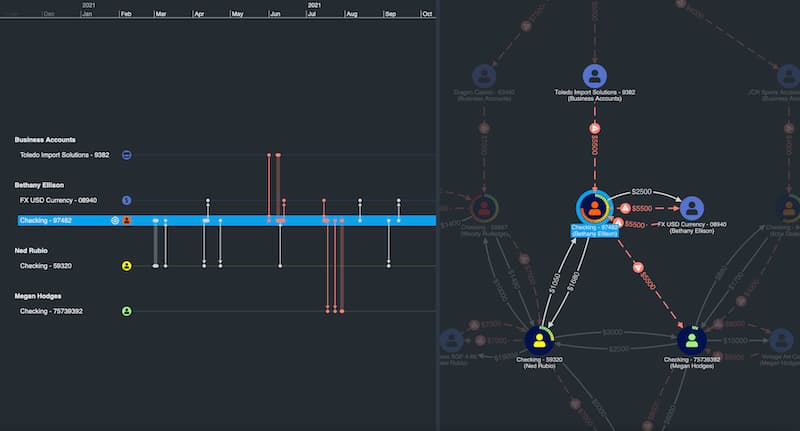
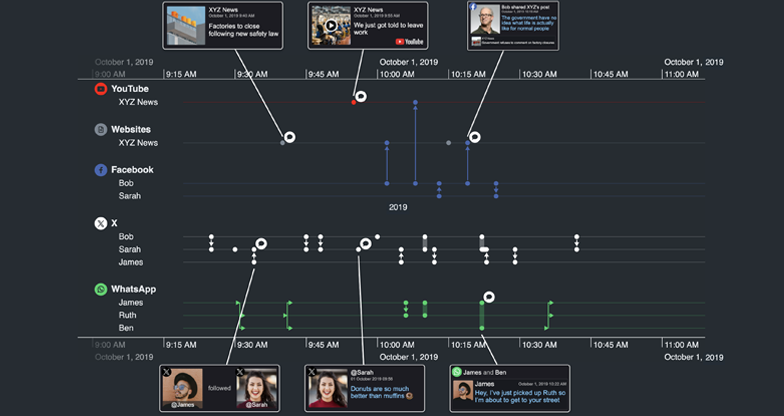
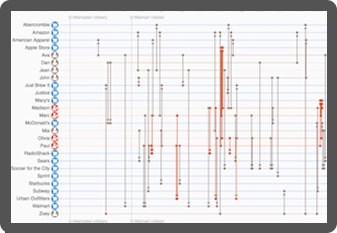
Money launderers create complex webs of accounts and transactions to conceal their illegal activities.
Unpicking those networks is sometimes called a ‘follow the money’ investigation – tracing funds through financial transactions – and involves the analysis of records to understand the parties involved.
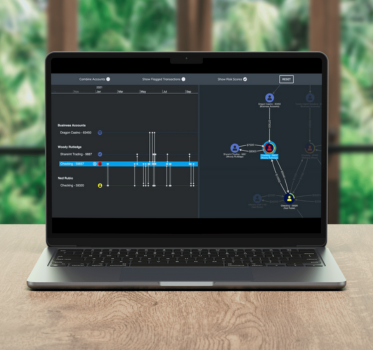
Graph and timeline visualization provides rich insight into complex sequences of transactions, helping to expose money laundering activity.
Read more about link analysis and AML
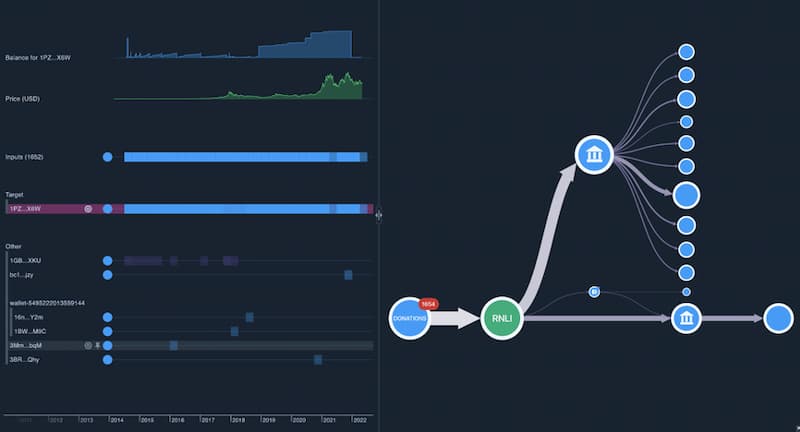
Cryptocurrencies pose a challenge for financial services institutions. It’s thought that a typical large US bank will process billions of dollars of undetected crypto-related transfers each year – effectively flying beneath the radar of their risk and compliance processes. There’s increasing regulatory pressure on them to take a proactive approach and stop this.
Regulators are consistently tightening regulations that apply to organizations involved in the cryptocurrency industry.
In recent years we’ve seen the US Treasury’s Financial Crimes Enforcement Network (FinCEN) regulations extended to cover virtual asset service providers (VASPs) such as crypto exchanges.
More than ever, organizations need to understand cryptocurrency activity.
Read more about cryptocurrency AML compliance
Learn more in our white paper
We’ve helped some of the world’s biggest banks visualize their data.
Download our Managing risk and threat in financial services white paper
Compliance data visualization for privacy data and content regulations
Another challenging area is data protection. Around the world, a patchwork of regulations require organizations to follow various data protection principles.
One example is the European General Data Protection Regulation (GDPR), which requires all organizations in the EU, or doing business in the EU, to identify and justify the personal data they hold. This means understanding a complex network of data connections between data, processes, platforms, people and places.
Graph visualization is a transparent and intuitive way to see information across the organization. It focuses on connections so that users can identify data collected or stored outside of compliance rules, and understand how the risk propagates through systems.
Analysts need an easy way to explore the subnetworks inside their data. Combos allow entities to be grouped, simplifying complex views but leaving additional detail to explore on demand.
The growth of generative AI gives bad actors easy access to tools capable of spreading misinformation and disinformation online.
The EU Digital Services Act (DSA) requires online platforms to proactively prevent the spread of misinformation and other harmful activities on their systems. It mostly impacts 17 named organizations, but also applies to over 10,000 smaller providers who host user-generated content.
A key pillar is the reporting and removal of harmful content, requiring content teams to act as the first line of defense. To comply, providers need effective content investigation tools.
Read more about misinformation and disinformation analysis with data visualization.
Compliance data visualization for supply chain and processes
A third category of increasingly complex regulatory oversight is health and safety.
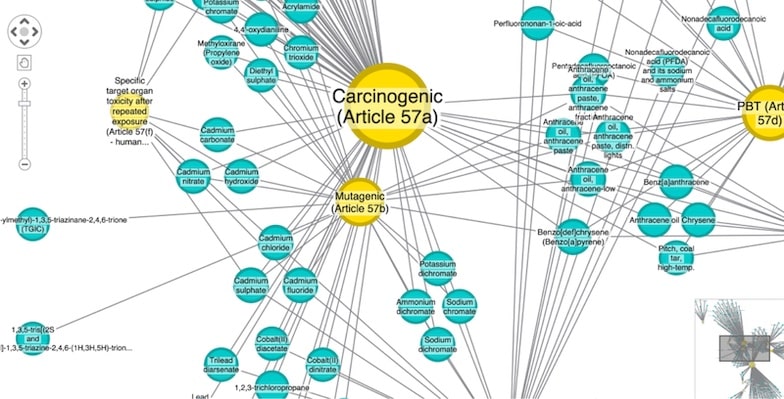
REACH (‘Registration, Evaluation, Authorization and Restriction of Chemicals’) requires EU companies to trace and register every substance used in their products, and then mitigate potential risks.
It’s a huge logistical challenge, especially for products with complex and diverse supply chains.
Graph visualization is the ideal way to bring together, analyze and understand the scattered supply chain data that organizations working to achieve REACH compliance need to understand.
Custom regulatory compliance data visualization
Organizations worldwide trust our graph visualization and timeline visualization toolkits to deliver regulatory compliance data visualization tools. Here’s why they choose us.

See the full picture
Interact with data from across the organization in a single chart. Our products’ flexible approach means you can overcome data silos and gain insight into information from multiple sources, giving you a clearer, more complete picture of events.

Visualization that scales
Our toolkits support visual analysis at scale. Whether that means you’ve got a large and distributed team, or huge volumes of data to analyze, we’ve designed our products to scale-up to any size organization and operation.

Get answers faster
Discover more intuitive ways to understand your compliance data. Timeline and graph analysis tools reveal connected data insight more effectively than other automated or manual processes, leading to faster and better decisions and risk mitigation.

Custom tools that work for you
Visualization tools, custom designed for your compliance managers and the data they need to understand, empower anyone to find insight in complex data. The result: insightful and straightforward tools that people want to use.
Want to try it for yourself?
KeyLines
The graph visualization SDK for JavaScript developers
KeyLines is your fast-track to graph visualization success on any tech stack.
ReGraph
Hassle-free graph visualization for React developers
ReGraph for React makes building state-based graph visualizations a breeze.
KronoGraph
Advanced timeline visualizations that scale quickly & easily
Build advanced interactive timeline views, customized for your applications.
MapWeave
The geospatial visualization SDK that uncovers every connection
Build groundbreaking apps that make geospatial connections clear, without the clutter.