Powered by
KeyLines
Graph visualization for JavaScript developers
Enjoy the flexibility to code how you like. Add graph visualization to your applications that work anywhere, as part of any stack.
Build powerful graph & timeline tools on Neo4j
Our toolkits – KeyLines, ReGraph, MapWeave and KronoGraph – are software development kits (SDKs) for graph, geospatial and timeline visualization. They make it easy to create powerful interactive visualization tools that bring your data to life. These tools can then be rolled into your existing workflows and products, helping your users to explore and understand their data.
Our SDKs are 100% database agnostic, but integrate seamlessly with the Neo4j graph database. They also work with any browser, device or server, leaving you free to choose the stack that works best for you.
Our developer toolkits make building graph and timeline visualization apps with Neo4j a breeze. Combining performance with a hassle-free developer experience, they provide a completely flexible way to create graph and timeline visualization UIs that work anywhere, on any device.
They also integrate seamlessly with the Neo4j graph database, giving your users an intuitive and interactive way to visualize and explore the data they need to understand.
Whatever your stack, we have an integration tutorial to get you started.
Learn how to create graph and timeline visualization applications that empower users to see, explore and understand the data in their Neo4j database.
Powered by
Enjoy the flexibility to code how you like. Add graph visualization to your applications that work anywhere, as part of any stack.
Build for developers. Loved by teams.
We design our toolkits with a fast developer experience in mind.
Equipped with our quick-start Neo4j demos, coding playgrounds, comprehensive docs and expert support, you’ll ship your Neo4j application in no time.
Whether you’re using Cypher of the BOLT protocol, Neo4j Community, Enterprise or AuraDB, our toolkits integrate seamlessly.
We also have JavaScript and React-specific examples to get you started.
Our toolkits let you customize every aspect of your Neo4j application – from branding to functionality.
The result is useful, insightful experiences your users value, and your competitors envy.
From timelines to centrality measures, automated layouts to geospatial maps.
Our SDKs have a huge range of visualization functions and analysis algorithms to uncover insight in your most complex Neo4j datasets.
We’ve been the leading provider of graph and timeline visualization technologies since 2011.
Hundreds of organizations worldwide rely on our toolkits – from pioneering startups to Fortune 500s and national governments.
We work year-round creating new features, ready to roll into your apps.
Keep customers happy and competitors on the back foot with constantly-improving, beautiful and unique visual analytics.
Bring clarity, confidence and interactive intelligence to your product – with visualizations that transform how users understand and explore complex data.
Neo4j is the world’s most popular graph database. Since its first production deployment in 2003, Neo4j has been downloaded millions of times and gained a reputation as a robust and efficient way to store and analyze graph data.
It’s also powerful: autonomous clustering allows for easy horizontal scaling, and its graph model offers speeds 1000x faster than traditional relational databases for complex queries. Combined with a very easy learning curve, it’s a popular graph database option for cloud applications.
Neo4j offers two of its own visualization tools.
The Neo4j browser is a simple visualization component, included in all Neo4j editions, to help administrators and developers build the database, and browse and optimize data structures.
Neo4j Bloom is a more advanced end-user visualization tool, available with an Enterprise license. It’s a user-friendly way to search, filter and visually explore Neo4j graph data.
If you find Neo4j’s built-in visualization applications do not offer the end-user experience or advanced functionality you require, or if you need to embed advanced visualization directly into your own products or workflows, you should consider visualization technologies like KeyLines, ReGraph and KronoGraph.
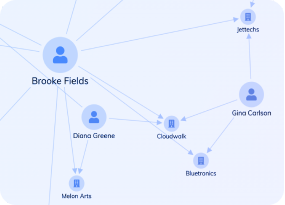
KeyLines is our JavaScript software development toolkit (SDK) for graph visualization. It makes it quick and easy for JavaScript developers to build custom, powerful and interactive graph visualization tools. These can be rolled into your existing products and shipped to unlimited end-users.
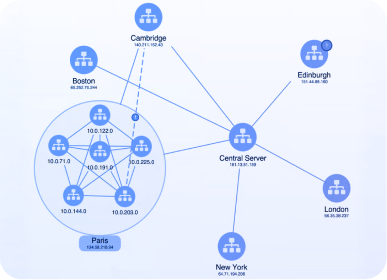
ReGraph is our React SDK for graph visualization. It offers the same performance, scalability and end-user functionality as KeyLines, but is specifically designed for React developers.
Every aspect of the SDK is optimized to feel as ‘React-native’ for the developer as possible, including fully-reactive components, state and data flow management and JSX-coded elements with clear syntax.
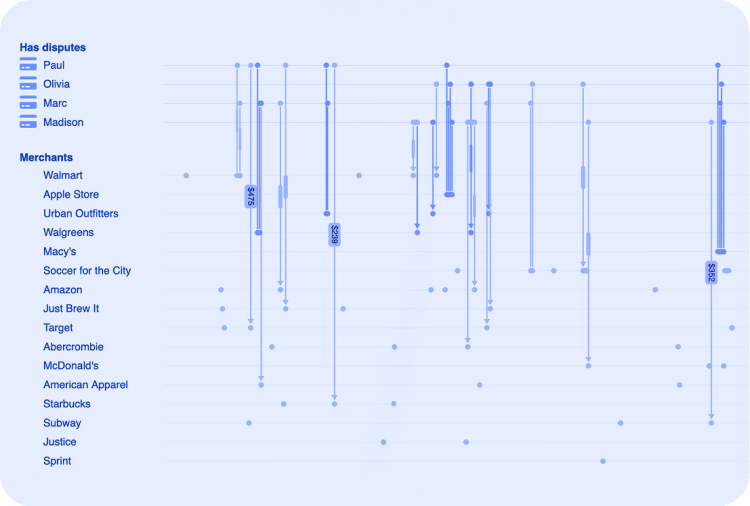
KronoGraph is our SDK for building interactive timeline applications. It comes with both plain JavaScript and React APIs.
The timelines built with KronoGraph reveal how events unfold over time, including heatmap views, individual event views, and intelligence data aggregation.
The toolkits are front-end JavaScript components, so you choose how to connect them to Neo4j – using Cypher or the BOLT protocol. You just need to make sure that the data is converted into our custom JSON format.
Our tutorials demonstrate some of these options, but let us know if your requirements aren’t covered. You can also find Neo4j quick-start documentation and example demos in our SDK sites.
Hundreds of organizations worldwide use our toolkits to make sense of complex connected data. Their industry sectors include: security and intelligence, risk and compliance, and cyber threat intelligence.
If you’re not ready to get started yet, take a look at our blog. You’ll find useful information on all aspects of Neo4j data visualization and best practice.
If you want to explore your options with other graph databases, please visit our visualizing graph databases page.