FREE: Start your ReGraph trial today
Visualize your data! Request full access to our ReGraph SDK, demos and live-coding playground.
To build a high-performance, scalable graph visualization application, you need a reliable way to store and query your data. Neo4j is one of the most popular graph database choices among our customers. It’s well-documented, easy to use and feature-complete, with sharding, ACID compliance and Cypher support.
In this blog post, I’ll outline three simple steps to create an interactive React Neo4j visualization tool. We’ll use ReGraph, our graph visualization SDK for React, and the StackOverflow sample dataset from the Neo4j Sandbox, but the approach can be adapted for any connected dataset stored in any kind of Neo4j instance.
If you’re using plain JavaScript, our tutorial on visualizing Neo4j with KeyLines will help. And if your users need to examine data that changes over time, you should also consider using interactive timelines alongside a node-link visualization. Take a look at our Neo4j and KronoGraph tutorial to find out more.
As the world’s most popular graph database, Neo4j offers unmatched tools and integrations to support graph application developers. No matter what tech stack you’re using, you’ll find valuable resources to help you get started quickly.
This tutorial focuses on the interaction between ReGraph and Neo4j. To keep things simple, we’ll limit the database configuration to the essentials needed to get an interactive visualization up and running.
When you’re ready to move to production, you’ll want to create a dedicated Neo4j instance, API layer and proper authentication and authorization. But for now, we only need to think about three tools:
The Neo4j Sandbox – a free, hosted Neo4j instance that comes with multiple data collections. This will replicate a full Neo4j database and let us test our Cypher querying.
The use-neo4j npm package – a pre-packaged set of components and hooks for React applications using Neo4j, including helper functions to manage credentials and drivers. Using this means we can avoid too much boilerplate code and start visualizing data faster.
ReGraph – our graph visualization SDK for React. It’s the fastest way to build powerful graph applications in a fully reactive way. It comes with a rich collection of visual analysis functionality that you can implement with a few lines of code, including automated layouts, social network centrality measures, a time bar, geospatial views and node filtering and combining.
If you’re not already a user of ReGraph, you can request a free trial now.
Visualize your data! Request full access to our ReGraph SDK, demos and live-coding playground.
Let’s start with the front end. We’ll create a basic React app to act as our foundation. I’m using Vite, so we can do that with:
npm create vite@latest my-react-app -- --template react
Then go into the created app folder:
cd my-react-app
And add ReGraph as a dependency. You can grab the ReGraph file from the ‘downloads’ page of the SDK site, once you’ve started your trial.
cp ~/Downloads/regraph-#.#.#.tgz .
yarn add file:regraph-#.#.#.tgz
Now we can create our first ReGraph chart. That requires a few changes to the App.jsx file in src:
import './App.css';
import { Chart } from 'regraph';
function App() {
  return (
    <>
      <Chart
        style={{ flex: 1, width: '100vw', height: '100vh' }}
        items={{ node: { label: { text: 'Hello World!' } } }}
      />
    </>
  );
}
export default App;
The Neo4j Sandbox is great when you’re working on a proof-of-concept prototype. Head to https://neo4j.com/sandbox/ and sign up. With just a few clicks, you have a stable Neo4j instance ready to go.
Once you’ve created a free Neo4j Sandbox account, you’ll see options inviting you to pre-populate your database with sample data or upload your own. For this tutorial, we’ll explore the Stack Overflow dataset.
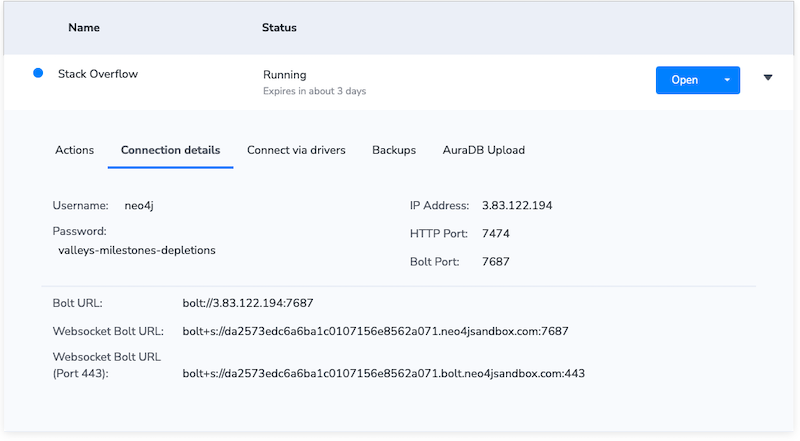
Next, go back to the Sandbox homepage and click on the ‘Connection details’ tab. Take a copy of these for the next step.
At this point, you could visualize your data in the Neo4j browser or Neo4j Bloom – their native graph visualization tools. The Browser is a simple visualization component to help admins and developers understand and optimize their data structures. Bloom is a more advanced visual analysis tool.
They both offer handy ways to see your data without further code, but ReGraph gives you more advanced functionality, infinitely flexible UI options and the ability to embed visualizations into other applications and workflows. So let’s continue.
With both ReGraph and Neo4j running, the final step is to connect them.
The use-neo4j npm package makes this simple. First, we install it:
npm i --save use-neo4j
Then we pass our database details to the driver using the createDriver function:
import React from 'react';
import ReactDOM from 'react-dom/client';
import App from './App.jsx';
import { Neo4jProvider, createDriver } from 'use-neo4j';

const driver = createDriver(
  'neo4j', 		// scheme
  '44.205.255.246', // IP address
  7687, 		// port number (Bolt port)
  'neo4j',		// username
  'password' 		// password
);

ReactDOM.createRoot(document.getElementById('root')).render(
  <React.StrictMode>
    <Neo4jProvider driver={driver} showDatabase={false}>
      <App />
    </Neo4jProvider>
  </React.StrictMode>
);
And that’s it. We now have a Neo4j instance connected to a working ReGraph application, ready to visualize graphs. Let’s take a closer look at the Stack Overflow sample.
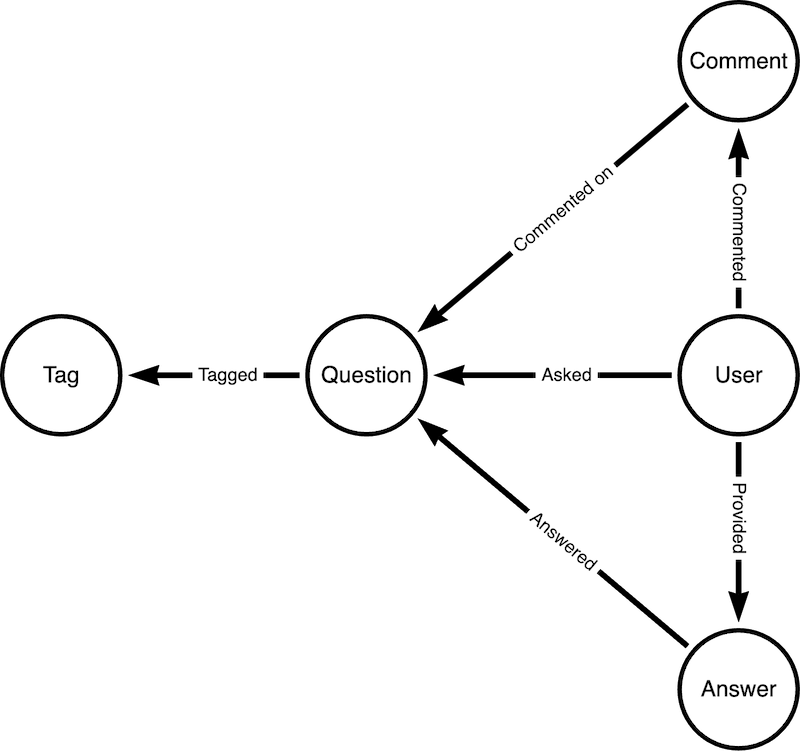
Our Sandbox contains a subset of Neo4j-related Stack Overflow questions. There are five node types, connected in the following model:
Using Cypher, we can easily query this dataset based on its connections. For example, the following query identifies the 20 most frequently co-occurring pairs of tags, returning these pairs along with the frequency of their co-occurrence.
MATCH (t1:Tag)<-[:TAGGED]-()-[:TAGGED]->(t2:Tag)
WHERE id(t1) < id(t2)
WITH t1, t2, count(*) as freq
ORDER BY freq DESC
LIMIT 20
RETURN t1, t2, {type: "CO_OCCURRENCE", frequency: freq} AS relationship
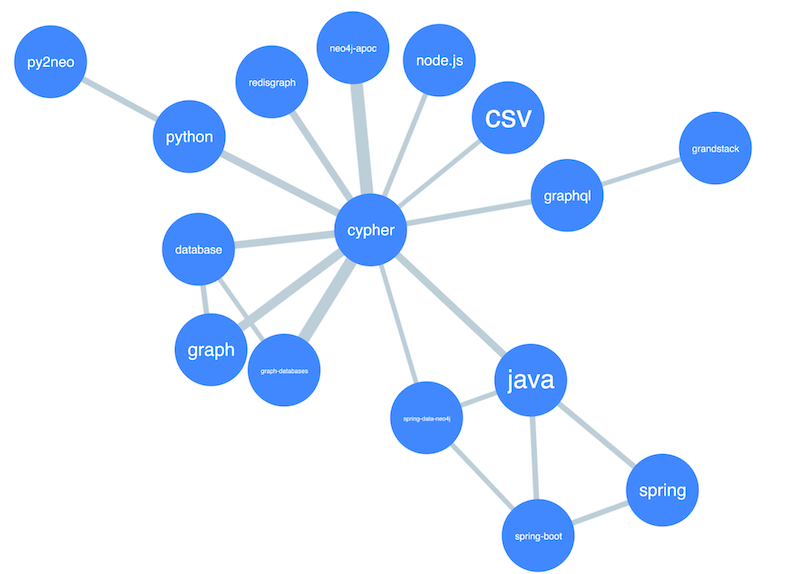
This means we can see which question topics tend to come together. Unsurprisingly, everything in this view links back to a central Neo4j node:
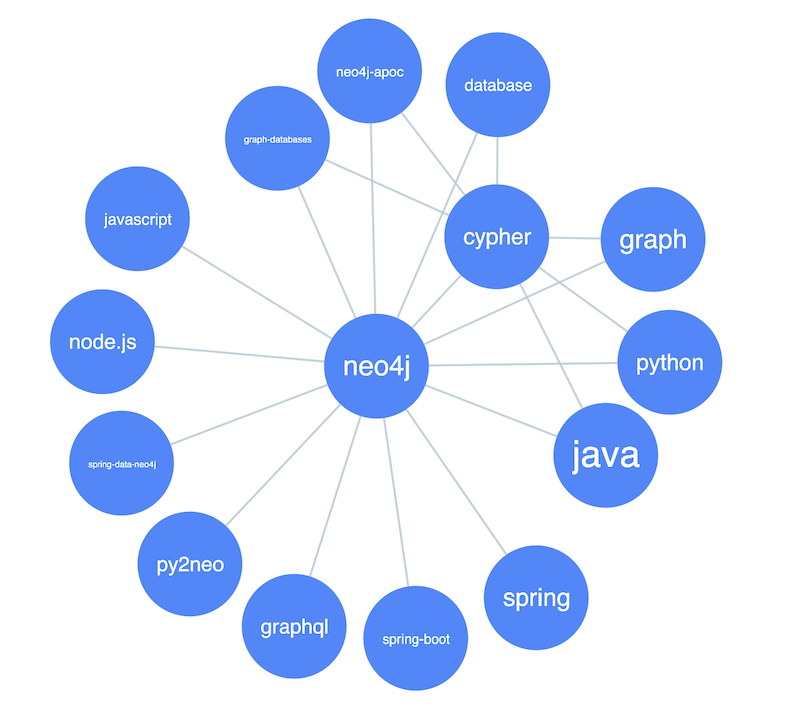
This is a common challenge early on in a graph visualization project - a single, heavily-connected node dominates the chart. There are a few strategies for dealing with starburst graphs, but the simplest is to filter out the supernode. We’ll do it in the front end, using a ReGraph filter, but if you want to remove it at source then your Cypher query would be:
MATCH (t1:Tag)<-[:TAGGED]-()-[:TAGGED]->(t2:Tag)
WHERE id(t1) < id(t2) AND t1.name <> 'neo4j' AND t2.name <> 'neo4j'
WITH t1, t2, count(*) as freq
ORDER BY freq DESC
LIMIT 20
RETURN t1, t2, {type: "CO_OCCURRENCE", frequency: freq} AS relationship
We can also size the links, to represent the strength of connections between them:
ReGraph’s many features include social network analysis centrality measures - algorithms to calculate the relative importance of different nodes in a network.
We can tie these scores to visual styling in the chart, so larger and darker nodes represent the nodes with the highest degree centrality:
Data visualizations are more insightful when they’re interactive. We can encourage users to explore the data more deeply with an “expand” interaction, which fetches additional data from Neo4j.
We’ll add a glyph to nodes with up to seven additional links not already shown in the visualization, to show they can be expanded. We’ve limited it to seven to avoid overloading the user, but you can set any limit you like.
By listening to the double-click event and using a hook from the use-neo4j package, users can query the database and fetch additional data just by interacting with the ReGraph chart. These newly retrieved items are then parsed, styled, and added.
Finally, we’ll add one final effect to our visualization. Let’s use foregrounding to highlight the immediately-connected nodes on selection. It’s a great way to draw focus on the sub-networks you want to pay attention to:
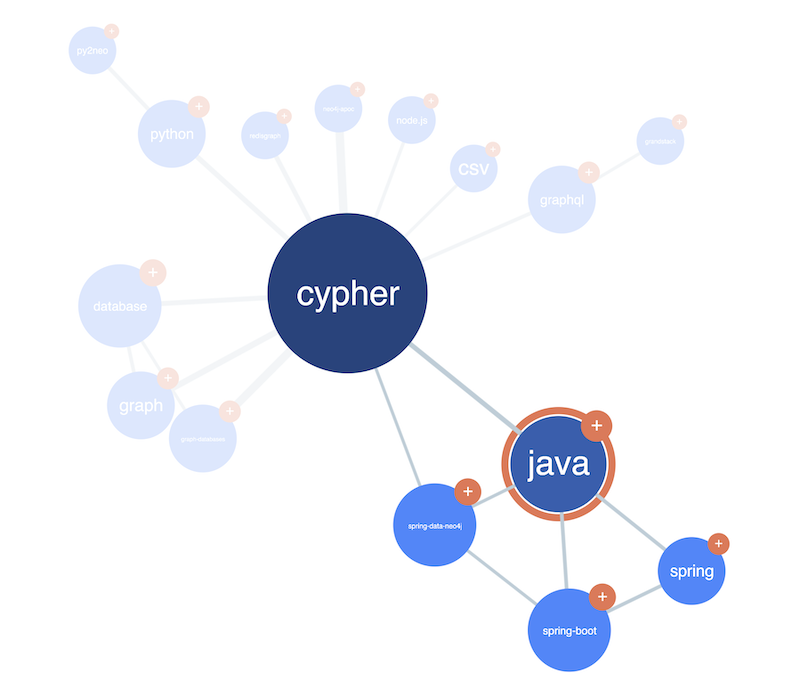
We can see some patterns, perhaps indicating the relative popularity (or difficulty!) of different parts of the Neo4j stack and its associated languages. By querying the relationships between the tags, we can make further deductions, like Spring and spring-boot being the most popular Java frameworks among Neo4j users.
This is just a starting point. With a bit more work, we could show activity over time in ReGraph’s time bar, or nest question nodes inside tag combos to incrementally explore the full dataset. Perhaps we could assign centrality scores to individual users based on their comment and answer history, to identify subject experts on specific topics.
ReGraph’s rich library of functionality makes adding React Neo4j visualizations to your applications fast and easy. If you’d like to learn more, request a free trial.
Visualize your data! Request full access to our ReGraph SDK, demos and live-coding playground.
Registered in England and Wales with Company Number 07625370 | VAT Number 113 1740 61
6-8 Hills Road, Cambridge, CB2 1JP. All material © Cambridge Intelligence .
Privacy Policy | Security Framework


