Introducing ReGraph for React developers
Catherine Kearns Content Strategist & Team Lead
7th May, 2019 | 2 min read
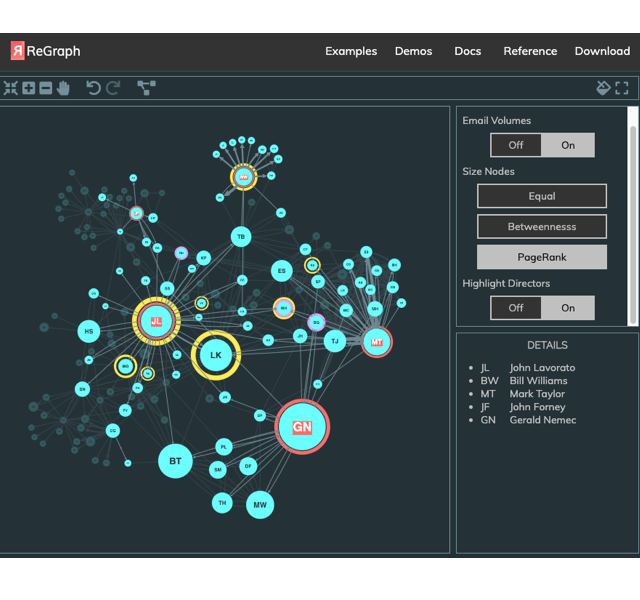
Cambridge Intelligence launches an Early Access Program for ReGraph – a brand new graph data visualization...
Advanced data visualization powered by Azure Cosmos DB
Catherine Kearns Content Strategist & Team Lead
2nd May, 2019 | 3 min read
We’re pleased to announce that the latest member to join the Cambridge Intelligence Technology Alliance is Azure...
Game of Nodes: Visualizing a 13-14th century social network
Catherine Kearns Content Strategist & Team Lead
14th January, 2019 | 6 min read
In this blog post, we’ll bring a medieval community to life. Our graph visualizations will help us gain insight...
Bring time-series data to life with visualization
Catherine Kearns Content Strategist & Team Lead
3rd December, 2018 | 8 min read
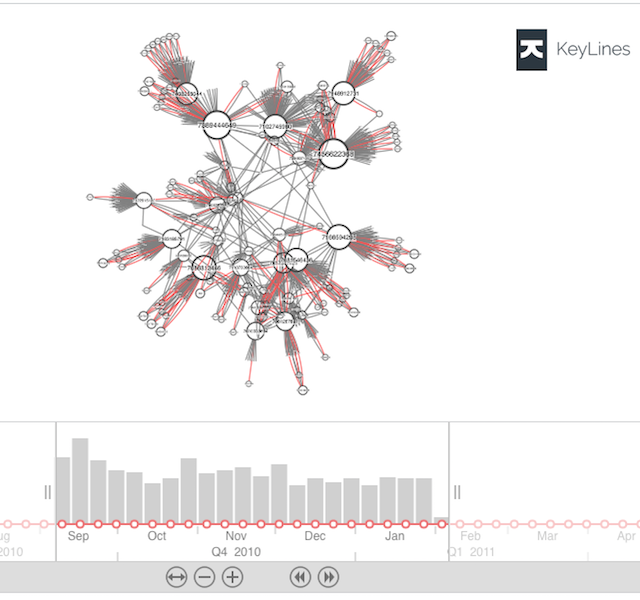
We integrate KeyLines with InfluxDB – a time series database (TSDB) – to see how it can help us...


