Introducing space-saving rectangular combos
Catherine Kearns Content Strategist & Team Lead
15th December, 2020 | 5 min read
Our ReGraph and KeyLines graph visualization toolkits support new rectangular combos: a fresh approach to grouping...
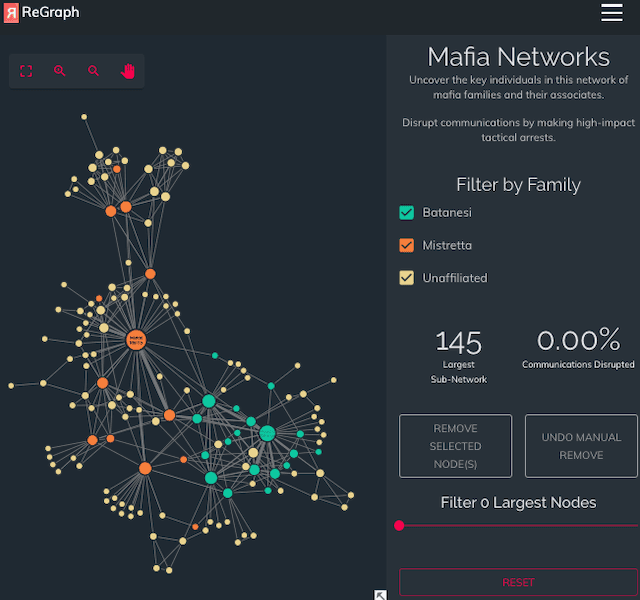
Python graph visualization using Jupyter & ReGraph
Catherine Kearns Content Strategist & Team Lead
27th October, 2020 | 12 min read
In this blog post we’ll show you how quick and easy it is to integrate JupyterLab and ReGraph to create...
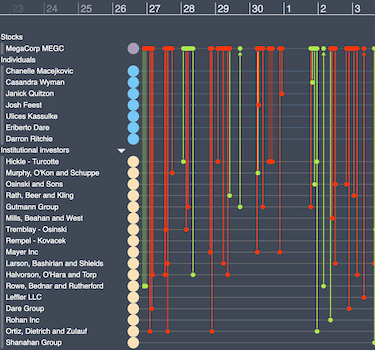
KronoGraph: timeline visualization that drives investigations
Catherine Kearns Content Strategist & Team Lead
8th September, 2020 | 2 min read
Cambridge Intelligence, creators of data visualization technologies that make the world safer, today announced...

How Hume & KeyLines make levels of insight skyrocket
Catherine Kearns Content Strategist & Team Lead
18th August, 2020 | 7 min read
Find out how GraphAware’s Hume and KeyLines help the European Space Agency see the power of Natural Language...
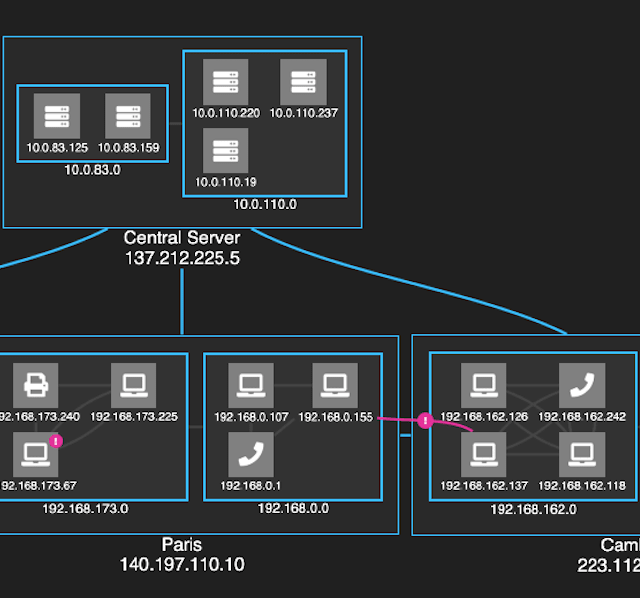
Cambridge Intelligence launches ReGraph 2.0
Catherine Kearns Content Strategist & Team Lead
17th July, 2020 | 2 min read
Cambridge Intelligence release the latest major version of ReGraph, the graph data visualization toolkit for React...
Visualizing the best strategic collaborations
Catherine Kearns Content Strategist & Team Lead
15th June, 2020 | 6 min read
There’s a growing need for apps that design the best strategic collaborations, bringing together the right...
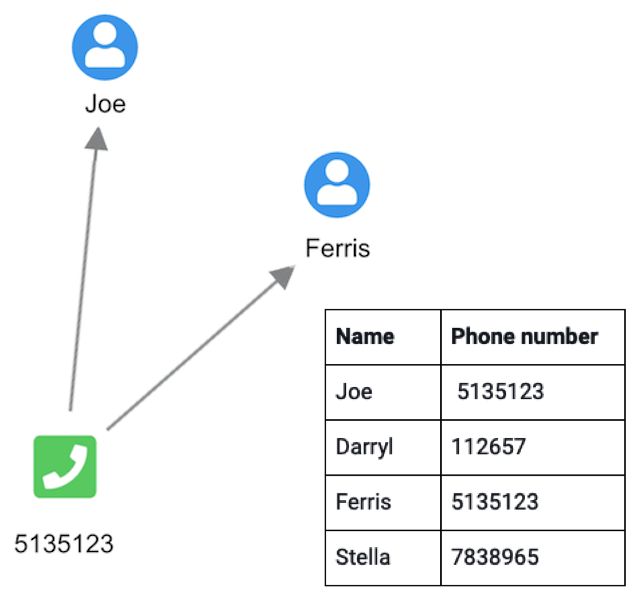
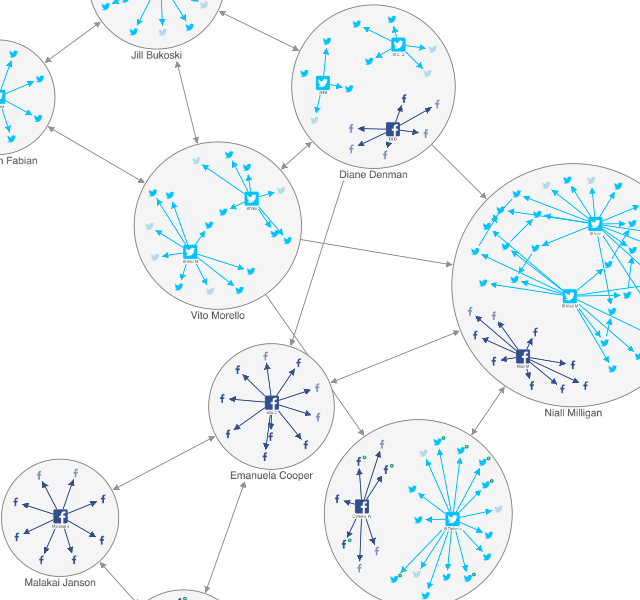
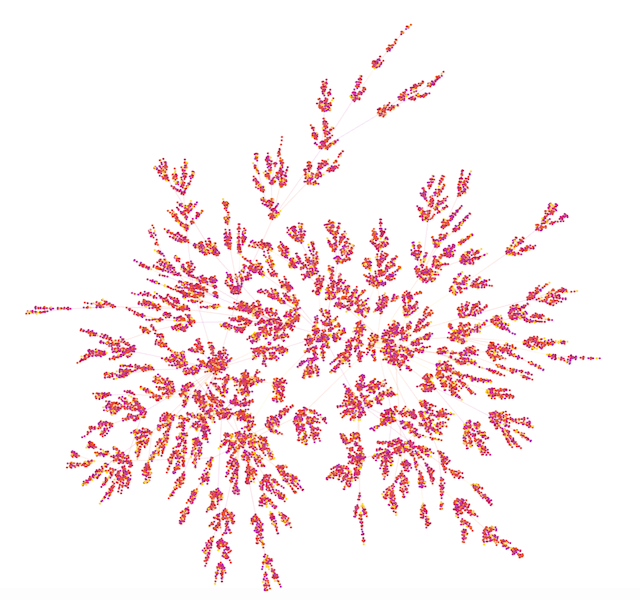
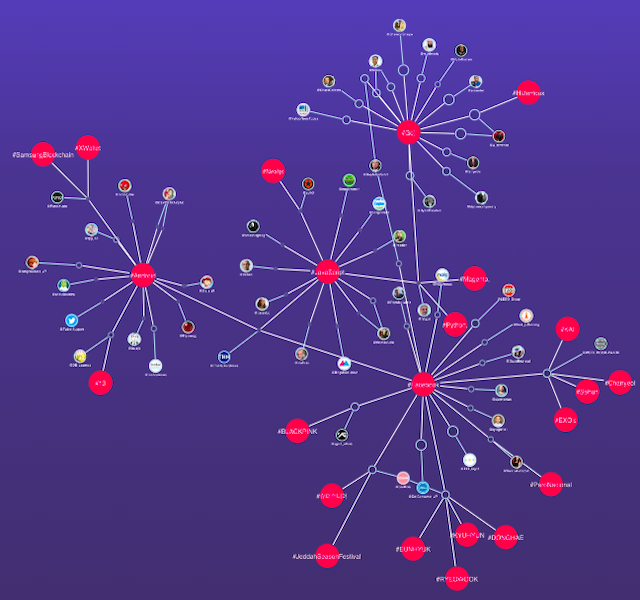
Graph visualization: the basics
Catherine Kearns Content Strategist & Team Lead
21st April, 2020 | 15 min read
A non-technical, high-level introduction to graphs, graph models, graph databases and graph...
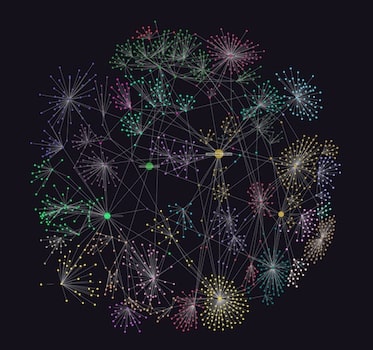
How ReGraph’s powerful performance measures up
Catherine Kearns Content Strategist & Team Lead
16th March, 2020 | 5 min read
ReGraph’s powerful rendering gives your analysts the quality and speed they expect from a superior graph...
ReGraph v1.0: Graph visualization for React developers
Catherine Kearns Content Strategist & Team Lead
23rd July, 2019 | 2 min read
After a successful Early Access Program, we’re proud to release v1.0 of ReGraph, our graph data visualization...
