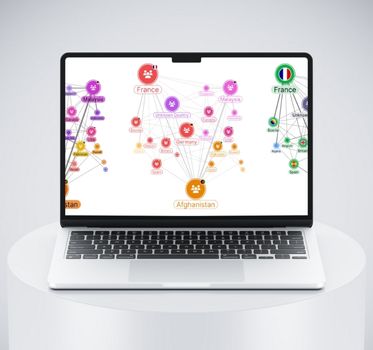
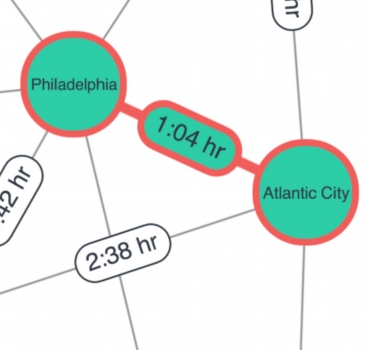
Graph visualization UX: Designing intuitive data experiences
Zach Mason Product Designer
24th June, 2025 | 18 min read
We share expert graph visualization UX principles that make the difference between user frustration and...
Zach Mason Product Designer
24th June, 2025 | 18 min read
We share expert graph visualization UX principles that make the difference between user frustration and...
Ivan Krushkov Commercial Development Lead
19th June, 2025 | 13 min read
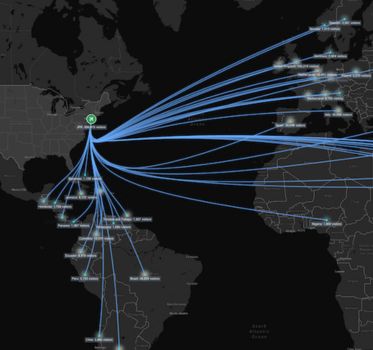
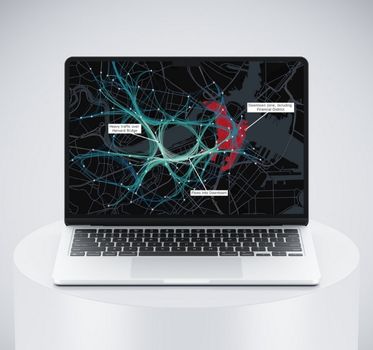
If you’re already using Mapbox for data visualization but need to reveal the hidden connections and...
Dan Williams Chief Product Officer
27th May, 2025 | 6 min read
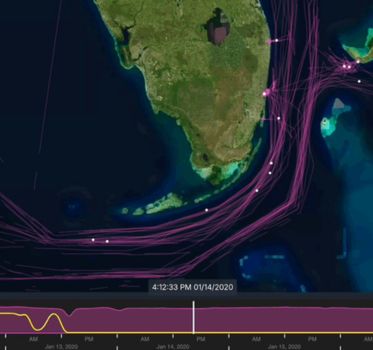
Maritime intelligence analysts contend with a growing list of challenges. Let’s explore how modern...
Rosy Hunt Content Marketing Specialist
20th May, 2025 | 2 min read
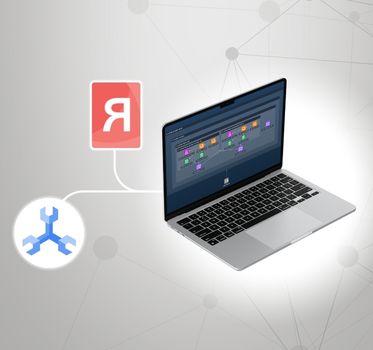
We’ve developed an integration with Google Cloud’s Spanner Graph that showcases how our combined technologies...
Courtney Collins Product Manager
13th May, 2025 | 3 min read
From sleeker animations to richer styling and smoother interactions, these updates help you create visualizations...
Dan Williams Chief Product Officer
8th May, 2025 | 3 min read
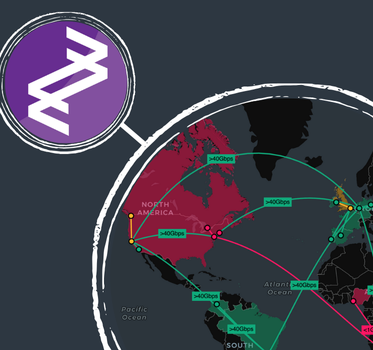
MapWeave, our new geospatial data visualization SDK for building map-based investigation and intelligence tools,...

Rosie Griffin HR Advisor
15th April, 2025 | 6 min read
Who doesn’t love a holiday? No matter how much you love your job and your team, it’s great to take time away...
Ryan Hamilton Client-facing Developer
31st March, 2025 | 11 min read
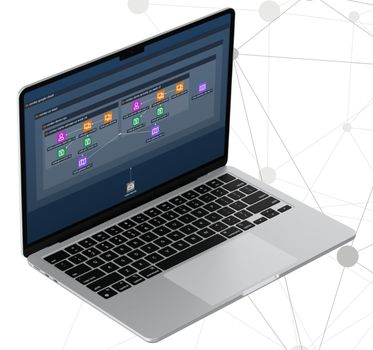
We walk you through how to build a cloud security application that leverages an integration between Google...
Bonney O'Hanlon Product Manager
12th March, 2025 | 5 min read
Say goodbye to cluttered maps, disjointed geospatial visualization and analysis that only tells you half the...