FREE: Visualizing cyber security threats
The ultimate guide to keeping networks, systems and IT infrastructure safe using data visualization.
Once, cyber threats were only seen as a risk to an organization’s tech environment. Cyber threat detection fell to IT managers or CISOs. Unless there was a major incident, there wasn’t a great deal of input (or interest?) from the rest of the business.
But not any more.
According to Gartner, 88% of boards of directors surveyed now view cybersecurity as a business risk rather than a technology risk. And that risk keeps increasing as attackers consistently develop more advanced and dangerous threats.
When cybercriminals strike, forensic analysis and vulnerability patches take priority over the product roadmap. Ransomware payments drain budgets. Management attention gets pulled to managing reputational fallout and steadying the share price. Competitive advantage is at risk.
So how do top organizations tackle cyber threats?
We’ve explored reports and survey results by Gartner, Splunk, IBM, Thales and Palo Alto, and looked at key takeaways from RSA Conference (RSAC) 2023 to identify areas for teams to consider.
91% of respondents agree that better capture and analysis of detection data is one of the most effective tools to prevent successful ransomware attacks.
In his State of Cybersecurity keynote at RSAC, Kevin Mandia (Mandiant CEO, Google Cloud) highlighted an important advantage businesses have over cyber attackers: “you know your environment better than they do”. But getting to know your environment well enough is no easy feat. Analysts focused on cyber threat detection need to understand big, complex, high-velocity data from across their organization. The most effective way to analyze this data is to visualize and interact with it.
Splunk’s number one recommendation is “to use data and analytics to optimize threat detection and response”. They found that respondents were using analytics across their entire attack lifecycle to “improve threat detection (37%), help identify cyber risks (36%) and accelerate investigations (33%)”.
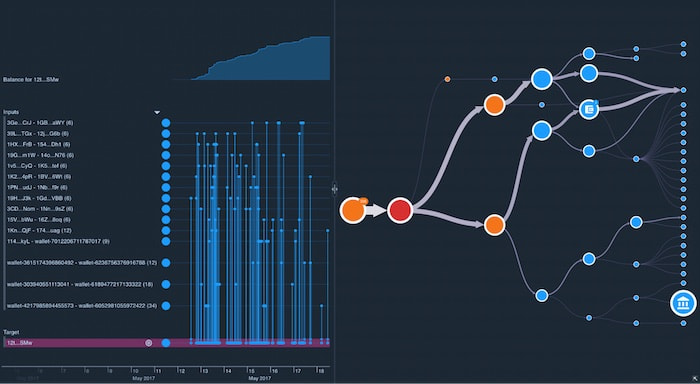
We know from our most successful customers in the cybersecurity industry that data visualization plays a powerful role at every stage. Graph and timeline visualization helps to predict when and where an attack may happen. They uncover patterns, reveal outliers and highlight anomalies.
Interestingly, IBM found that the share of breaches caused by ransomware attacks grew by 41% in 2022. But despite 67% reporting data loss from ransomware attacks, a report by Thales shows that only 49% of enterprises have a formal response ransomware plan.
Business leaders need to take notice of ransomware risks due to the high-profile nature of the threat (think about the $4 billion WannaCry attack). One way to do this is to recognize data visualization and analysis tools as an essential part of their cybersecurity strategy.
Organizations are racing toward modernizing their infrastructure, with software smart and fast enough to respond to current and future threats, and to achieve cyber resilience.
During a recent visit to RSA Conference expo, one thing stood out: the need to present a complete narrative of when attacks unfold, not just how they occurred. We noticed more cyber tools featuring – often primitive – timeline analysis capability than ever before.
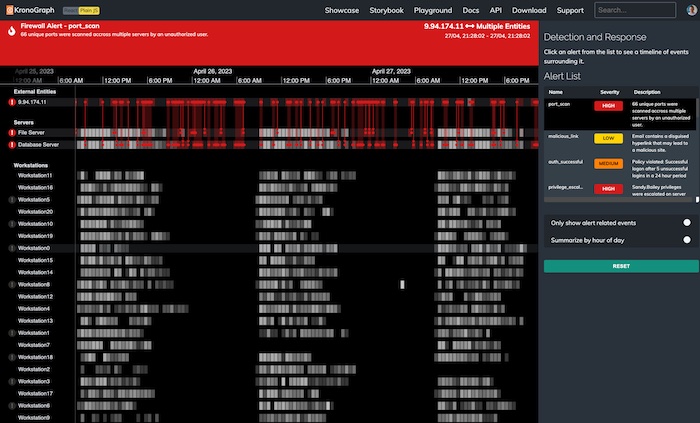
Timeline analysis is critical to cyber threat detection and to finding ways to neutralize those threats faster in future. We’ve seen an increase in demand for our timeline visualization toolkit, KronoGraph as organizations need to dig deeper into how events unfold and how they’re linked. It’s especially popular among existing graph visualization users who are keen to get a new perspective on their network data.
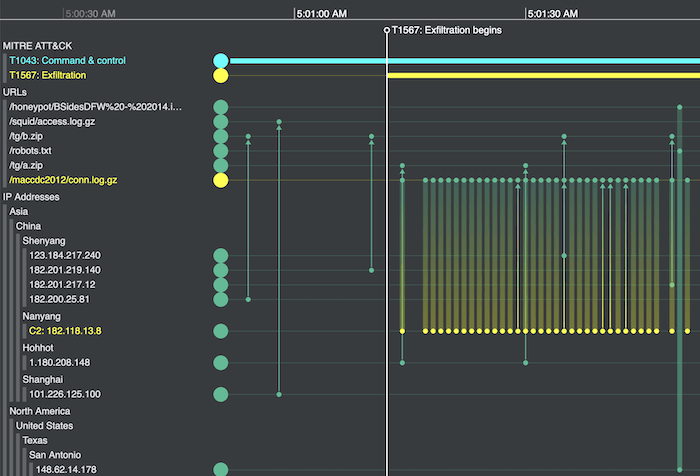
Splunk recognizes that “timelining puts data in context with other artifacts”. While graph visualization proved network and link analysis to understand relationships behind the data, timelines reveal the exact sequence of data points. And when analysts deal with high-velocity network traffic, those data points are difficult to analyze effectively without the right tools.
Time-based analytics reveals deeper insights into what’s happening across your networks. Dynamic and interactive, they give cyber threat analysts the ability to carry out forensic timeline analysis and find vulnerabilities or suspicious activities fast.
There was a note of caution in some of the RSAC presentations: beware of things being ‘whizzy’ or ‘shiny’ just for the sake of it. Style over substance isn’t going to help your cybersecurity business strategy. Newer techniques like timeline analysis deliver real value, particularly when used alongside network and link analysis.
64% of SOC teams complain about pivoting among too many disparate security tools and management consoles, with little (if any) integration, inhibiting comprehensive and timely investigations and response.
Many organizations struggle with security tool overload. Each new product adds implementation and maintenance overhead, and increases the potential surface for a cyber attack. So it’s no surprise that Palo Alto reported “77% of respondents said they are highly likely to reduce the number of security solutions and services they rely on”.
This doesn’t mean a reduction in focus or commitment when it comes to cybersecurity. It means moving to consolidated tools that are fully comprehensive and scalable. If you’re a vendor in this market, are you providing the full complement of data analysis techniques in your product? How do you stack up against your competitors?
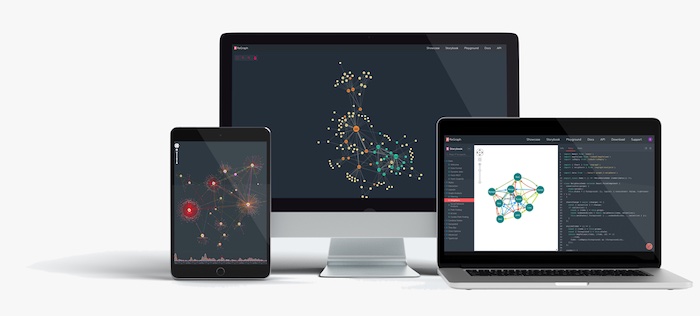
Some of the world’s biggest cybersecurity companies use our toolkits to add graph and timeline visualization components to their existing web applications. They ‘just work’ in any setup, integrate seamlessly and securely, delivering visual analysis inside your existing products and workflows.
37% of respondents say lack of executive alignment on prioritizing cybersecurity is one of the top three challenges across their organization.
Some business leaders only expect to hear from their security team if there’s a problem. 22% of Splunk respondents think that their “executive management lacks cybersecurity knowledge and commitment”.
Having a well-informed leadership team on matters of cybersecurity and threats means you’ll know the right questions to ask of your security team. There are many articles on this, and I like the Digital Guardian’s list which includes “What risk framework are you using?” and “How often do you test our cybersecurity incident response plans?”.
In their key takeaways from RSAC, attendee Erin Lemky noticed “the need to effectively report on the organization’s cybersecurity posture to the C-Suite and Board is increasingly on people’s minds – in sessions, while networking, and in the expo”.
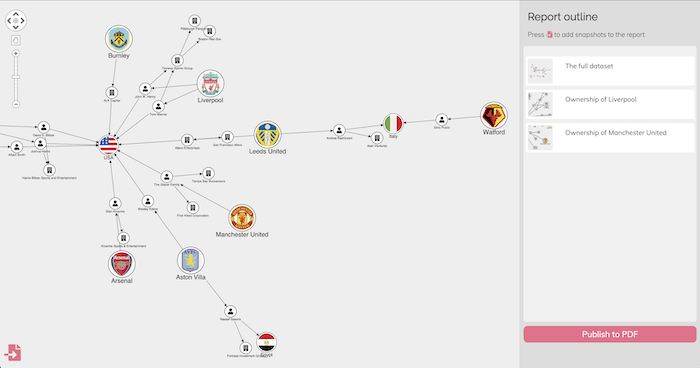
It’s vital to share details of cybersecurity incidents in an accessible format, whether that’s the status of security alerts, potential vulnerabilities or the evolution of a malicious attack. With our toolkits you can export detailed visualizations as PDF reports or images keeps senior managers informed and engaged.
95% of security budgets will increase over the next two years — 56% of them significantly.
Increased budgets won’t automatically translate into increased revenues for all cyber vendors. The market is more competitive than ever, and customers will choose products that have the most to offer. Managers expect to see returns.
In response to this increased investment in cybersecurity, managers expect to see returns.
In their article on RSAC, Menlo Ventures felt that there’s an “evolving perception of security as a revenue driver rather than a cost center”.
Gartner has written on a similar theme with the suggestion that boards are putting pressure on security teams to see what returns they’re getting from years of spending on cybersecurity tools. They say that “CISOs will need to collaborate closely with executive leadership to reframe cybersecurity investment in a business context.”
With IBM reporting that the global average total cost of a data breach is $4.35M, you can easily position your business’s cybersecurity expenditure as an investment. The price of a comprehensive, fully-interactive cyber analysis and visualization tool greatly outweighs the potential losses and disruptions from existing and emerging threats.
[If you want to measure the value of adding visualization to your existing analysis tool, we’ve created a simple method you can follow. See How to calculate the ROI of a data visualization component]
49% say that they lack enough staff to manually triage, investigate and respond to an increasing volume of security events.
The shortage of talent in the tech sector shows no signs of improvement, and it’s particularly difficult in the cybersecurity industry. Splunk found that 88% reported some kind of talent challenge, whether that’s just recruiting enough people or finding those with the right skills.
It’s a problem if you don’t have enough staff or expertise to monitor alerts, respond to red flags, analyze data to help predict and prevent future breaches. Splunk also found that “41% of alerts that would be beneficial to investigate are ignored due to a lack of available bandwidth”.
[For more on how to handle staff attrition rates, see A CEO’s 8 greatest fears (and how to face them)]
But what if your cybersecurity team could do more with less? What if they had a faster, more responsive way to get insights?
With a data visualization component as part of your web application, the alerts that matter don’t go unnoticed. It’s easier to spot anomalies at-a-glance and make quick decisions that could ultimately prevent an attack.
One final quote from Splunk’s excellent report: “31% of respondents said they spent most of their time addressing emergencies.”
Is your management team happy with that percentage? What if your cybersecurity team had the tools they need to identify patterns, inform future strategies and predict threats before they happen? Instead of firefighting, what if they could rely on data visualization to find new insights, get a clear picture of events and make faster decisions?
If you want to learn more about how our tools can power cyber threat detection, download the white paper or get in touch.
The ultimate guide to keeping networks, systems and IT infrastructure safe using data visualization.
Gartner: IT Roadmap to Cybersecurity for CISOs
IBM: Cost of a data breach report 2022
Palo Alto Networks: What’s Next in Cyber 2022 Global Survey
Registered in England and Wales with Company Number 07625370 | VAT Number 113 1740 61
6-8 Hills Road, Cambridge, CB2 1JP. All material © Cambridge Intelligence .
Privacy Policy | Security Framework


