FREE: Start your KeyLines trial today
Visualize your data! Request full access to our KeyLines SDK, demos and live-coding playground.
In this tutorial for JavaScript developers, I’ll demonstrate how to build a Neo4j visualizer with our graph visualization SDKs.
If you’re keen to create a Neo4j web application with our toolkits but not sure where to start, you’ll find this really useful. For brevity, I’ve shortened the code snippets throughout this tutorial, but if you want the full code, get in touch and we’ll be happy to share.
If you’re a React developer, we have a similar Neo4j tutorial for you too.
Neo4j has cemented itself as the market leader in graph database management systems, so it’s no surprise that many of our customers want to build a Neo4j visualizer to analyze the connected data stored in their databases.
The Neo4j resources I’ll use in this tutorial are:
Neo4j AuraDB – Neo4j’s cloud graph database service. It’s a great option if you don’t want the hassle of database administration. There’s a free tier that’s perfect for the example dataset we’re going to work with.
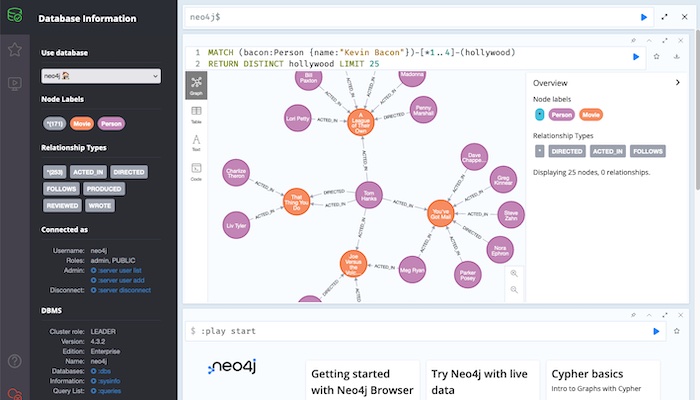
Neo4j Browser – the Neo4j web application, aimed at developers. You can query it using Cypher and explore the results in a functional visualization. Because it offers unrestricted access to the database, it’s used for prototyping and not for deployment to production environments.
Neo4j Bolt Protocol – this application protocol encodes plain text Cypher queries to a binary format, then sends them directly to the database via a WebSocket or standard TCP connection carried over PackStream. We’ve blogged about this before: see Hooking KeyLines up to the Neo4j Bolt Protocol
neo4j-driver – the official driver for JavaScript that connects to the Neo4j database via the Bolt Protocol
Neo4j Stack Overflow example dataset – as the largest online community for developer Q&A, Stack Overflow data features a rich source of connections between questions, answers, tags, users and more. Neo4j’s example dataset provides the perfect source material for our tutorial.
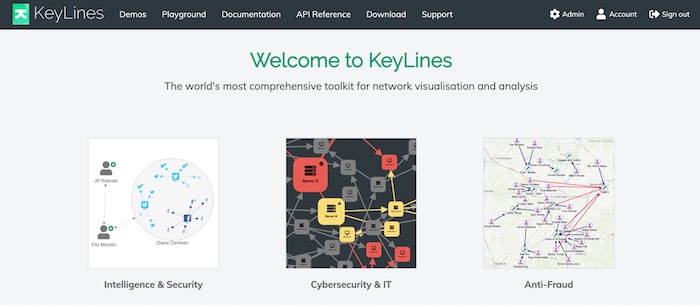
Our graph visualization toolkits are KeyLines and ReGraph – the only difference is that KeyLines is for JavaScript developers and ReGraph is designed for React-based graph visualizations. Both come with powerful graph visualization functionality – from automatic layouts to complex graph algorithms.
Our timeline visualization toolkit is KronoGraph, which supports both plain JavaScript and React. It works as a standalone tool but also integrates seamlessly with KeyLines or ReGraph, so users can perform advanced timeline and network analysis simultaneously.
All of our toolkits are front-end applications that slot easily into your existing Neo4j environment. Once they’re embedded into your Neo4j web application, you can customize each interaction and every node, edge, event and property to create the exact look and feel you want.
I’ll show you how easy it is to connect a Neo4j database to KeyLines and get a data visualization web app up and running quickly. If you’re not already using KeyLines, you can request a free trial.
Visualize your data! Request full access to our KeyLines SDK, demos and live-coding playground.
I’m keeping things simple here with lightweight architecture.
We’ll rely on the neo4j-driver that uses the Neo4j Bolt Protocol to communicate with the database. We’ll run this on the server side. For security reasons, you wouldn’t want real-world end users to communicate with the database directly.
The browser will transmit basic user interactions to the server, which will then translate them into Cypher queries to send to Neo4j AuraDB. That way, there’s no risk of a user writing their own Cypher queries and accessing data they’re not allowed to see or edit.
Right – let’s start building our Neo4j visualizer!
When you sign up for a free trial, you get access to the KeyLines SDK site which includes demos, tutorials, a fully-documented API and a downloadable version of the JavaScript library.
Create a new local folder for this project, and from the KeyLines SDK, download the latest version. Save the downloaded .tgz file into the project folder ready to install later.
If you don’t have access to Neo4j AuraDB already, you can sign up for free
When you’re prompted for an initial instance, select the StackOverflow Data example.
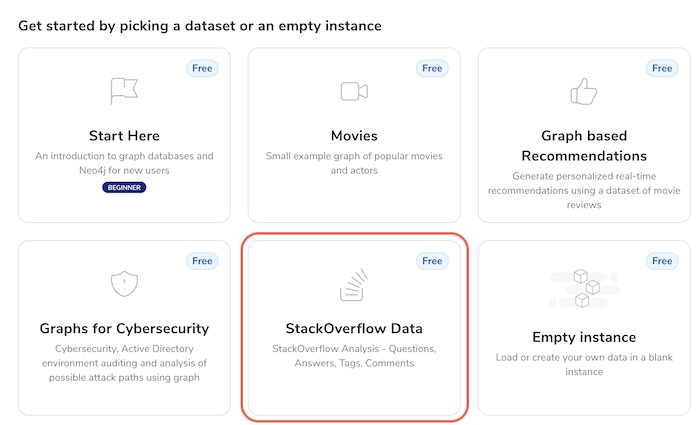
This dataset contains a subset of questions, topics, and answers posted about Neo4j on Stack Overflow, formatted as a graph:
Neo4j Browser is a great way to explore the data model in more detail, and get a sense of its shape.
Once we have our NodeJS server working, we can issue queries against the data.
In our two-tier architecture, the browser passes the name of the node we’re querying on to the server, which in turn generates the Cypher to pass to Neo4j. We’ll create a simple Node.js Express Server with an endpoint that accepts Cypher queries and returns JSON data.
Install the neo4j-driver node module, and then update the configuration to match the details you set up when you created the database in Neo4j AuraDB:
npm install neo4j-driver
Set up the express server by creating a server.js file:
Reminder: there’s no need to copy and paste these code snippets. Simply contact us for the entire tutorial code.
const path = require('path');
const express = require('express');
const setupNeo4jEndpoint = require('./neo4j-router.js');


const app = express();


app.use('/', express.static(path.join(__dirname, '/')));


app.get('/', function (req, res) {
 res.sendFile(path.join(__dirname, 'index.htm'));
});


setupNeo4jEndpoint(app);


app.listen(8080);


console.log('Server running. Browse to http://localhost:8080');
This code configures an endpoint which hosts the HTML file. It also allows the browser to pass a node ID which is passed on to Neo4j AuraDB as a Cypher query. These details are in neo4j-router.js, specifically the function setupNeo4jEndpoint:
const neo4j = require('neo4j-driver');


/**
* Neo4j database configurations
*/
const configs = {
 boltPath: 'bolt://your_path_to_aura',
 username: 'your_user_id',
 password: 'your_password',
};


// Set up the Neo4j Bolt driver
const driver = neo4j.driver(
 configs.boltPath,
 neo4j.auth.basic(configs.username, configs.password),
 { disableLosslessIntegers: true, maxTransactionRetryTime: 10000 },
);


const queryTemplates = {
 question: 'MATCH (question: Question {title: $nameParam })-->(n) RETURN question, n',
 user: 'MATCH (user: User {display_name: $nameParam })<--(n) return user, n',
 answer: 'MATCH (answer: Answer {title: $nameParam })<--(n) return answer, n',
 tag: 'MATCH (tag: Tag {name: $nameParam })<--(n) return tag, n',
 comment: 'MATCH (comment: Comment {name: $nameParam })--(n) return comment, n',


};


// takes an existing express app and attaches a handler to respond
// to fetch requests from the client by submitting cypher queries
// to the neo4j database using the JS driver.
function setupEndpoint(
 app, // express app
) {
 app.get('/neo4jdb/:queryType',
   async (req, res) => {
     const session = driver.session();
     res.on('finish', () => session.close());
     try {
       const response = await session.run(queryTemplates[req.params.queryType],
         { nameParam: req.query.name });
       let statement = response.summary.query.text.replace('$nameParam', `"${response.summary.query.parameters.nameParam}"`);
       statement = statement.replace('RETURN', '\nRETURN');
       console.info(`Neo4j statement: ${statement}`);
       res.send({ rawItems: response.records, statement });
     } catch (err) {
       console.error('Error connecting Neo4j', configs);
       res.send({ error: 'Error connecting Neo4j' });
     }
   });
}


module.exports = setupEndpoint;
Notice the query templates – this is the Cypher that’s submitted to Neo4j AuraDB. You’ll see that there are different queries for each of the node types, a question, answer, tag, user and comment. With each type, we’re matching a specific property that will get passed in from the browser.
I’ve used the generic variable n for the opposite end of the link: we’ll determine its type by inspecting the data that’s returned.
Our next file is neo4j-db.js. This is the JavaScript running in the browser that:
We need to decide which properties in Neo4j AuraDB correspond to the node and link IDs and labels. We’ll do this in the makeNode and makeLink functions:
function makeNode(fields, lookup, baseType) {
 const fieldRecords = fields[lookup[baseType]];
 let t;
 if (baseType === 'n') { //it's the opposite end of a link so we have to find the type
   baseType = fields[lookup['n']].labels[0].toLowerCase(); //this will tell us question, user, etc'
 }
 switch (baseType) { //control which property is the label depending on the type
   case 'comment':
     t = fieldRecords.properties.link;
     break;
   case 'user':
    t = fieldRecords.properties.display_name;
    break;
   case 'answer':
    t = fieldRecords.properties.title;
    break;
   case 'question':
    t = fieldRecords.properties.title;
    break;
   case 'tag':
    t = fieldRecords.properties.name;
    break;
 }
 const node = {
   id: fieldRecords.identity,
   type: 'node',
   t: t,
   d: {
     type: baseType,
   },
   tc: false,
 };
 return node;
}


function makeLink(id1, id2) {
 const link = {
   id: `${id1}-${id2}`,
   type: 'link',
   id1,
   id2 };
 return link;
}
The Neo4j Bolt Protocol returns the data in a difficult-to-parse format, so we need to use several lookups to get the actual fields we care about. These fields are different for each node type, so that’s the basis for the switch statement in the makeNode function above.
Also, remember that we just used n as the type of the item on the other end of the link from the item we queried. We need to inspect the Neo4j tag to determine the correct type in this case, then we’ll know which field to use as the node label in KeyLines.
We now have a service running the Cypher query, and a client-side driver that gets the results in the right format. Next we need to integrate KeyLines and apply styling. This code snippet is long, but there are two key points of interest:
const colours = {
 link: '#c4c4c4',
 selection: {
   dark: '#4f3271',
   light: '#f2edf7',
 },
 user: {
   node: '#9cc171',
   label: '#f3f6ee',
   border: '#dae7cb',
   fi: '#8fb95f',
 },
 question: {
   node: '#6b9ec7',
   label: '#f1f9fe',
   border: '#cbe3f2',
   fi: '#5991c0',
 },
 tag: {
   node: '#6b96c7',
   label: '#f1f9fe',
   border: '#cbe3f2',
   fi: '#5991c0',
 },
 answer: {
   node: '#699ec7',
   label: '#f1f9fe',
   border: '#cbe3f2',
   fi: '#5991c0',
 },
 comment: {
   node: '#299ec7',
   label: '#f1f9fe',
   border: '#cbe3f2',
   fi: '#5991c0',
 },
 transparent: 'rgba(0,0,0,0)',
};


const iconConfigs = {
 question: {
   icon: KeyLines.getFontIcon('fa-question'),
   alignment: {
     dy: -10,
     e: 0.85,
   },
 },
 comment: {
   icon: KeyLines.getFontIcon('fa-comment'),
   alignment: {
     dy: -10,
     e: 0.85,
   },
 },
 user: {
   icon: KeyLines.getFontIcon('fa-user'),
   alignment: {
     e: 0.92,
   },
 },
 answer: {
   icon: KeyLines.getFontIcon('fa-check'),
   alignment: {
     e: 0.92,
   },
 },
 tag: {
   icon: KeyLines.getFontIcon('fa-tag'),
   alignment: {
     e: 0.92,
   },
 },
};


/**
* Default values for chart.options
*/
const chartOptions = {
 arrows: 'large',
 logo: '/images/Logo.png',
 iconFontFamily: 'Font Awesome 5 Free Solid',
 fontFamily: 'Muli',
 handMode: true,
 hover: 0,
 selectedLink: {},
 linkEnds: {
   avoidLabels: false,
 },
 drag: {
   links: false,
 },
 selectedNode: {
   b: colours.selection.dark,
   fc: colours.selection.light,
 },
};


/**
* Styling for nodes and links
*/
function getItemStyles(type) {
 return {
   c: colours[type].node,
   b: colours[type].border,
   fbc: colours.transparent,
   fc: colours[type].label,
   fb: true,
   fi: {
     c: colours[type].fi,
     t: iconConfigs[type].icon,
   },
   tc: true,
 };
}


const itemStyles = {
 node: {
   question: {
     bw: 2,
     e: 2.5,
     ...getItemStyles('question'),
   },
   comment: {
     bw: 2,
     e: 2.5,
     ...getItemStyles('comment'),
   },
   user: {
     bw: 3,
     e: 1.5,
     ...getItemStyles('user'),
   },
   tag: {
     bw: 3,
     e: 1.5,
     ...getItemStyles('tag'),
   },
   answer: {
     bw: 3,
     e: 1.5,
     ...getItemStyles('answer'),
   },
 },
 link: {
   c: colours.link,
   w: 3,
 },
};


/**
* @param {String} id Node id
*/
async function expandFromNode({ id }) {
 const item = id && chart.getItem(id);
 if (item && item.type === 'node') {
   if (!item.d.expanded) {
     await expandData(item.d.type, item.d.query);
   }
 }
}


/**
* Disables action of delete key
* @param {event} e
*/
function disableDelete(e) {
 if (e.keyCode === 46) {
   e.preventDefault();
 }
}
Once the page loads, our initial query looks for a user named “NoahH” and pulls back all links from him, which in this case is just one question.
You’ll also need some basic HTML and CSS for this, all of which is available on request
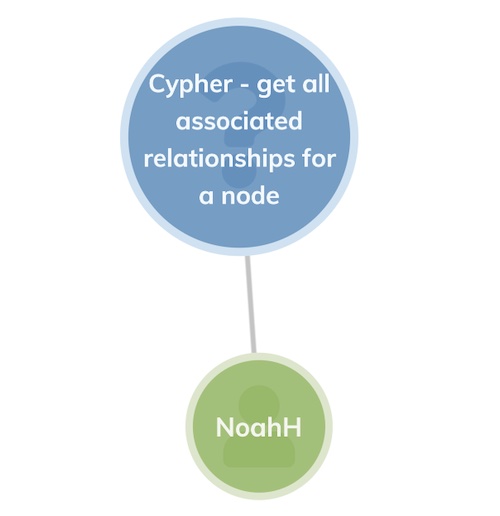
Font color and icon offer effective if basic styling. There are infinite customization and styling options available, plus a live-coding playground in each toolkit to experiment with your most ambitious designs. To get started, check out 4 API functions that’ll revolutionize your graph design
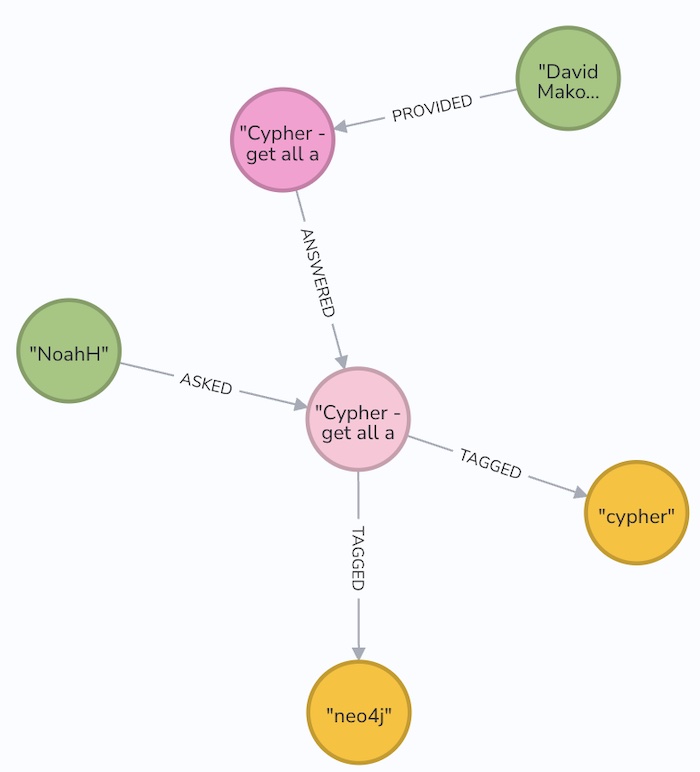
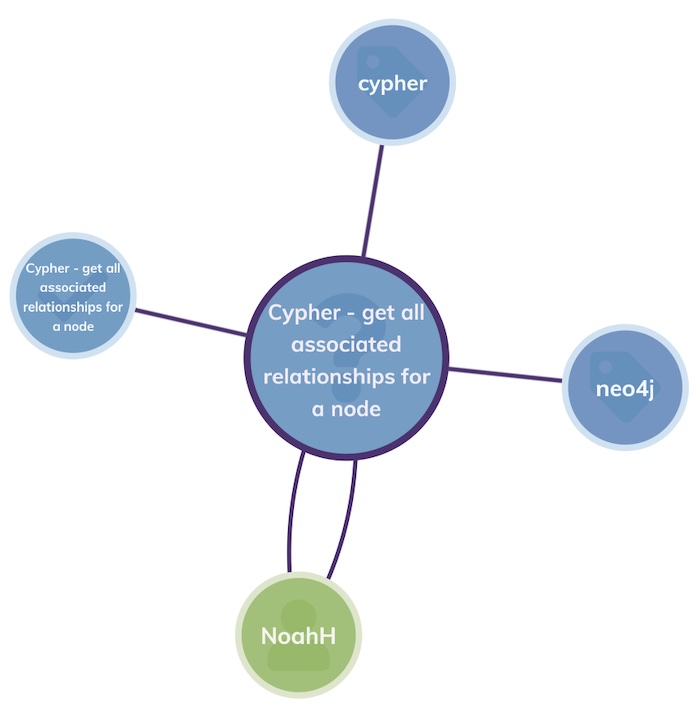
If we double-click on the blue question node, it sends another query to the database to look for any other linked nodes. In this case, it returns the answer (blue node on the left with a checkmark icon) plus two associated topic tags:
We can keep expanding to populate the chart with further relevant details. We may want to know who provided the accepted answer, so we’ll double-click on the node with the checkmark:
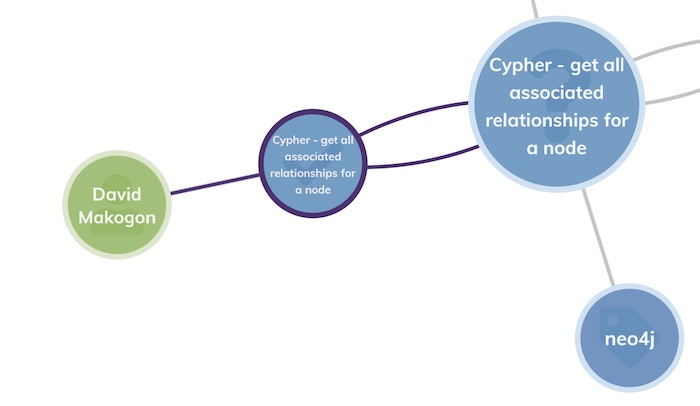
The Neo4j visualizer returns a green user node with the name of the person who answered: David Makogon.
You can keep on exploring the dataset by expanding in this way. One word of caution though: tags can have many questions associated with them, so you may end up with a very busy chart. In a real application, you can build in limits to these queries, or use a range of techniques so users don’t get overwhelmed. See Five steps to tackle big graph data visualization
If you followed these easy steps, you now have your own working Neo4j visualization web application. And with a few simple code tweaks, you can update your configuration and start visualizing and exploring your own Neo4j data. We’d be happy to help you with this – just ask.
Remember that the full code examples for this tutorial are available on request

Visualize your data! Request full access to our SDKs, demos and live-coding playgrounds.


