We know a few things about building great SDK products here at Cambridge Intelligence.
Over the years, thousands of developers have put our toolkits through their paces. Every comment, suggestion and request from them has fed back into our products, driving a program of continuous development and improvement.
The result is a collection of data visualization SDKs that make building powerful, intuitive and insightful data visualization tools a breeze.
The latest addition to those SDKs is KronoGraph – our toolkit for visual timeline analysis. We’ve blogged before about the great end-user experience you can design with KronoGraph, from policing and law enforcement to bitcoin and cryptocurrency visualization, root-cause analysis to insider fraud detection.
This time, we’ll look at KronoGraph’s awesome developer experience. It’s packed with neat tricks and handy shortcuts to make your job easier, faster, and more enjoyable.
Prefer to watch a video?
This blog post is also available as a webinar recording.
A plug & play timeline SDK
As a developer, you should expect 3 advantages from a great timeline SDK product: save time, save code and save effort. These free you up to focus on the rest of the application development process.
We’ve designed the KronoGraph timeline SDK to be as close to ‘plug & play’ as possible. We’ve thought through all the best practices and design options, embedding them into the default behaviors.
As a result, your timeline visualization will ‘just work’ as soon as you load your data – regardless of the data’s size, shape, or complexity. You’re free to change any of those defaults of course – that’s the beauty of an SDK – but we’ve done everything possible to make your life easier.
Here’s some sample phone call data which we’ve translated into KronoGraph’s JSON format, ready to load into a timeline.
{
   "events": {
    "07434677419-07610039694": {
      "entityIds": [
        "07434677419",
        "07610039694"
      ],
      "time": {
        "start": 1284578264000,
        "end": 1284578475000
      }
    },
    "07588304495-07641036117": {
      "entityIds": [
        "07588304495",
        "07641036117"
      ],
      "time": {
        "start": 1284060937000,
        "end": 1284061061000
      }
    },
    ...
  },
  "entities": {
    "07102745960": {
      "label": "Adrienne Benson",
      "data": {
        "country": "Australia",
        "region": "South East"
      }
    },
    "07456622368": {
      "label": "Isaac Harmon",
      "data": {
        "country": "Canada",
        "region": "North America"
      }
    },
    ...
  }
}
In it, we’ve identified entities (phone numbers) and the events (phone calls and text messages) and timestamps. Extra information, like names and labels, is in there too.
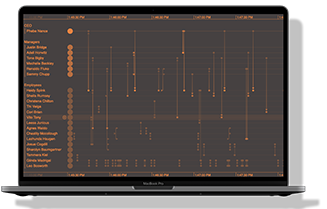
When we load the data, KronoGraph automagically aggregates the information into a heatmap view and displays the whole dataset in one go:
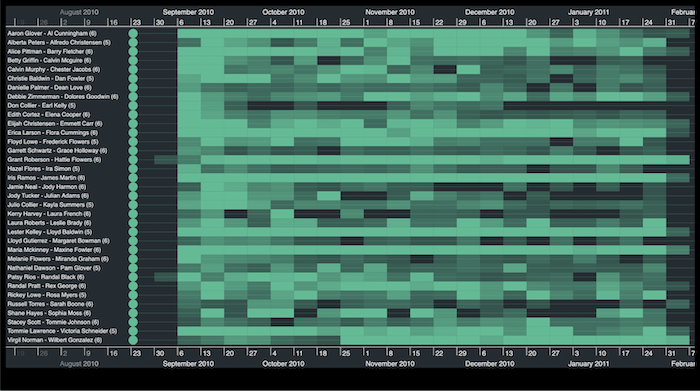
As we zoom in, the chart transitions seamlessly into an events view – showing more granular detail as the scope of our timeline reduces.
All of this behavior comes out of the box. All you need to do is get the data from the back-end and into KronoGraph in our documented JSON format. Pretty neat.
Conditional formatting made easy
Another area where the KronoGraph timeline SDK makes life so much easier is conditional formatting.
When our customers play with timelines, they often want to color-code events and entities by some kind of logic – blue for phone calls, red for text messages, for example.
Normally that involves creating a separate schematic file to cross-reference conditions and styles, and then applying stylings on top. Not in KronoGraph!
Instead, we just provide a type property on the entity, and then an entityType object which defines the styling for each type of entity. It’s much simpler to create and easier to maintain.
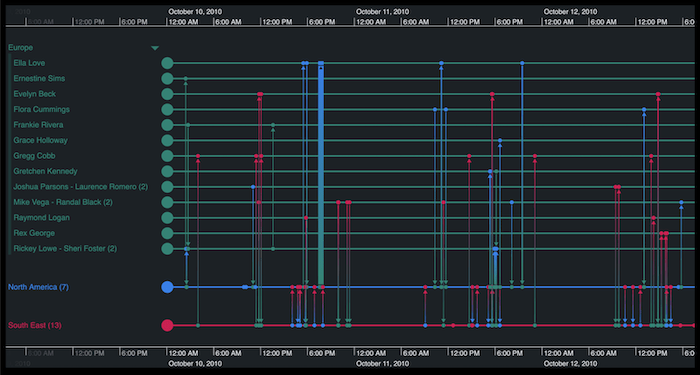
Returning to our phone calls data, here we’ve told KronoGraph to style all entities with the region ’South East’ in magenta, ‘North America’ in blue and ‘Europe’ in green:
{
  "events": {
    "07434677419-07610039694": {
      "entityIds": [
        "07434677419",
        "07610039694"
      ],
      "time": {
        "start": 1284578264000,
        "end": 1284578475000
      }
    },
    "07588304495-07641036117": {
      "entityIds": [
        "07588304495",
        "07641036117"
      ],
      "time": {
        "start": 1284060937000,
        "end": 1284061061000
      }
    },
    ...
  },
  "entities": {
    "07102745960": {
      "label": "Adrienne Benson",
      "type": "South East",
      "data": {
        "country": "Australia",
        "region": "South East"
      }
    },
    "07456622368": {
      "label": "Isaac Harmon",
      "type": "North America",
      "data": {
        "country": "Canada",
        "region": "North America"
      }
    },
    ...
  },
  "entityTypes": {
    "South East": {
      "color": "#e91e63",
      "labelColor": "#e91e63",
      "typeLabel": "South East"
    },
    "North America": {
      "color": "#2196f3",
      "labelColor": "#2196f3",
      "typeLabel": "North America"
    },
    "Europe": {
       "color": "#009688",
       "labelColor": "#009688",
       "typeLabel": "Europe"
    },
   ...
  }
}
And KronoGraph delivers:
What if you change your mind? Just go back and adjust your types or styles. It’s as simple as that.
Complex grouping made simple
Grouping is a challenging part of any large-scale data visualization.
With timelines, your users expect a clear view regardless of the volume of data they’re trying to visualize. That means deciding on a robust way to group entities.
The KronoGraph timeline SDK handles groups in much the same way it handles types. You just define them in the data, and let us do the rest.
{
  "events": {
    "07434677419-07610039694": {
      "entityIds": [
        "07434677419",
        "07610039694"
      ],
      "time": {
        "start": 1284578264000,
        "end": 1284578475000
      }
    },
    "07588304495-07641036117": {
      "entityIds": [
        "07588304495",
        "07641036117"
      ],
      "time": {
        "start": 1284060937000,
        "end": 1284061061000
      }
    },
    ...
  },
  "entities": {
    "07102745960": {
      "label": "Adrienne Benson",
      "type": "South East",
      "data": {
        "country": "Australia",
        "region": "South East"
      }
    },
    "07456622368": {
      "label": "Isaac Harmon",
      "type": "North America",
      "data": {
        "country": "Canada",
        "region": "North America"
      }
    },
    ...
  },
 "entityTypes": {
    "South East": {
      "color": "#e91e63",
      "groupBy": ["country"],
      "labelColor": "#e91e63",
      "typeLabel": "South East"
    },
    "North America": {
      "color": "#2196f3",
      "groupBy": ["country"],
      "labelColor": "#2196f3",
      "typeLabel": "North America"
    },
   ...
  }
}
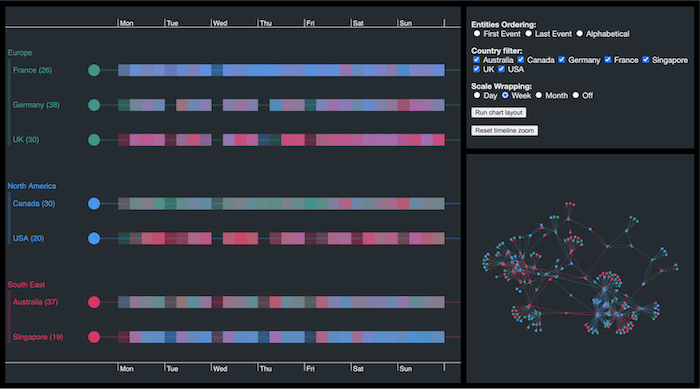
This method works for simple groups and nested groups, giving detail on-demand without overwhelming the user. Groups expand and close, appear and disappear automatically depending on the timescale you’re trying to understand.
Absolute control with JavaScript events
Interaction is a huge part of a successful data visualization tool. Get it right and the whole experience is logical and rewarding. Get it wrong and the user feels frustrated and confused.
KronoGraph’s default interaction behaviors are very intuitive – we’ve spent a lot of time thinking about them – but they’re easy to change, too.
Your timeline is probably part of a wider application or dashboard. To ensure consistent behaviors across all components, we’ve exposed various JavaScript events for you to bind to – click, drag, hover – nearly 20 at the time of writing.
That means you can integrate and synchronize your timeline component seamlessly with the rest of your application.
More insights with every release
The final thing developers love about KronoGraph is that we’re adding new high-quality functionality with every release – ready to deploy directly to your own users.
For example, scale wrapping is a powerful analysis feature that reveals behavior patterns over time. It’s simply a case of adding one line of code:
timeline.options({
      scales: {
        wrapping: scaleType // 'off' | 'day' | 'week' | 'month' | 'year'
      }
});
Now your users can see their timeline by day, week, month or year, unlocking fresh insight into their time-based data.
We’re always working on exciting new features. Watch this space for more innovative timeline analysis capability coming soon.
Get started fast – in JavaScript or React
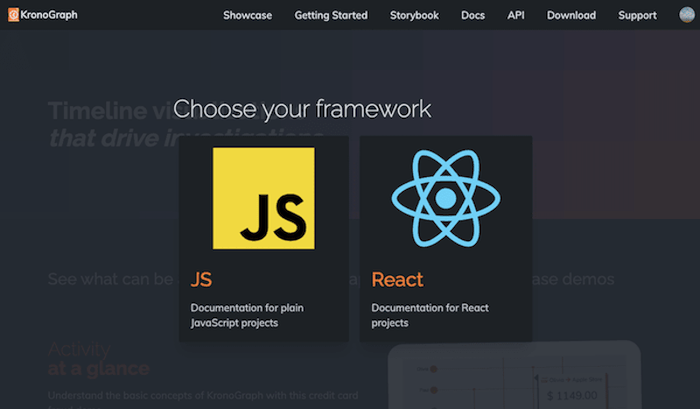
There’s one more thing developers love about KronoGraph: it comes in two flavors.
The JavaScript API is flexible enough to work with any JavaScript framework, or none. For React developers, there’s a React component that’ll drop seamlessly into your apps. Simply select the version you want when you login. From there, every example and code snippet will be optimized for your preferred coding language.
Oh, and both versions come with full TypeScript support too.
Try our timeline SDK
The best way to experience the KronoGraph timeline SDK is to try it for yourself. We know you’re going to love it!
FREE: Start your KronoGraph trial today
Visualize your data! Request full access to our KronoGraph SDK, demos and live-coding playground.


