KeyLines
The JavaScript SDK for interactive graph visualization.
KeyLines is your fast-track to graph visualization success on any tech stack.
Rapidly create robust, beautiful and engaging visual tools that match the scale of your users’ data challenges.
Explore our SDK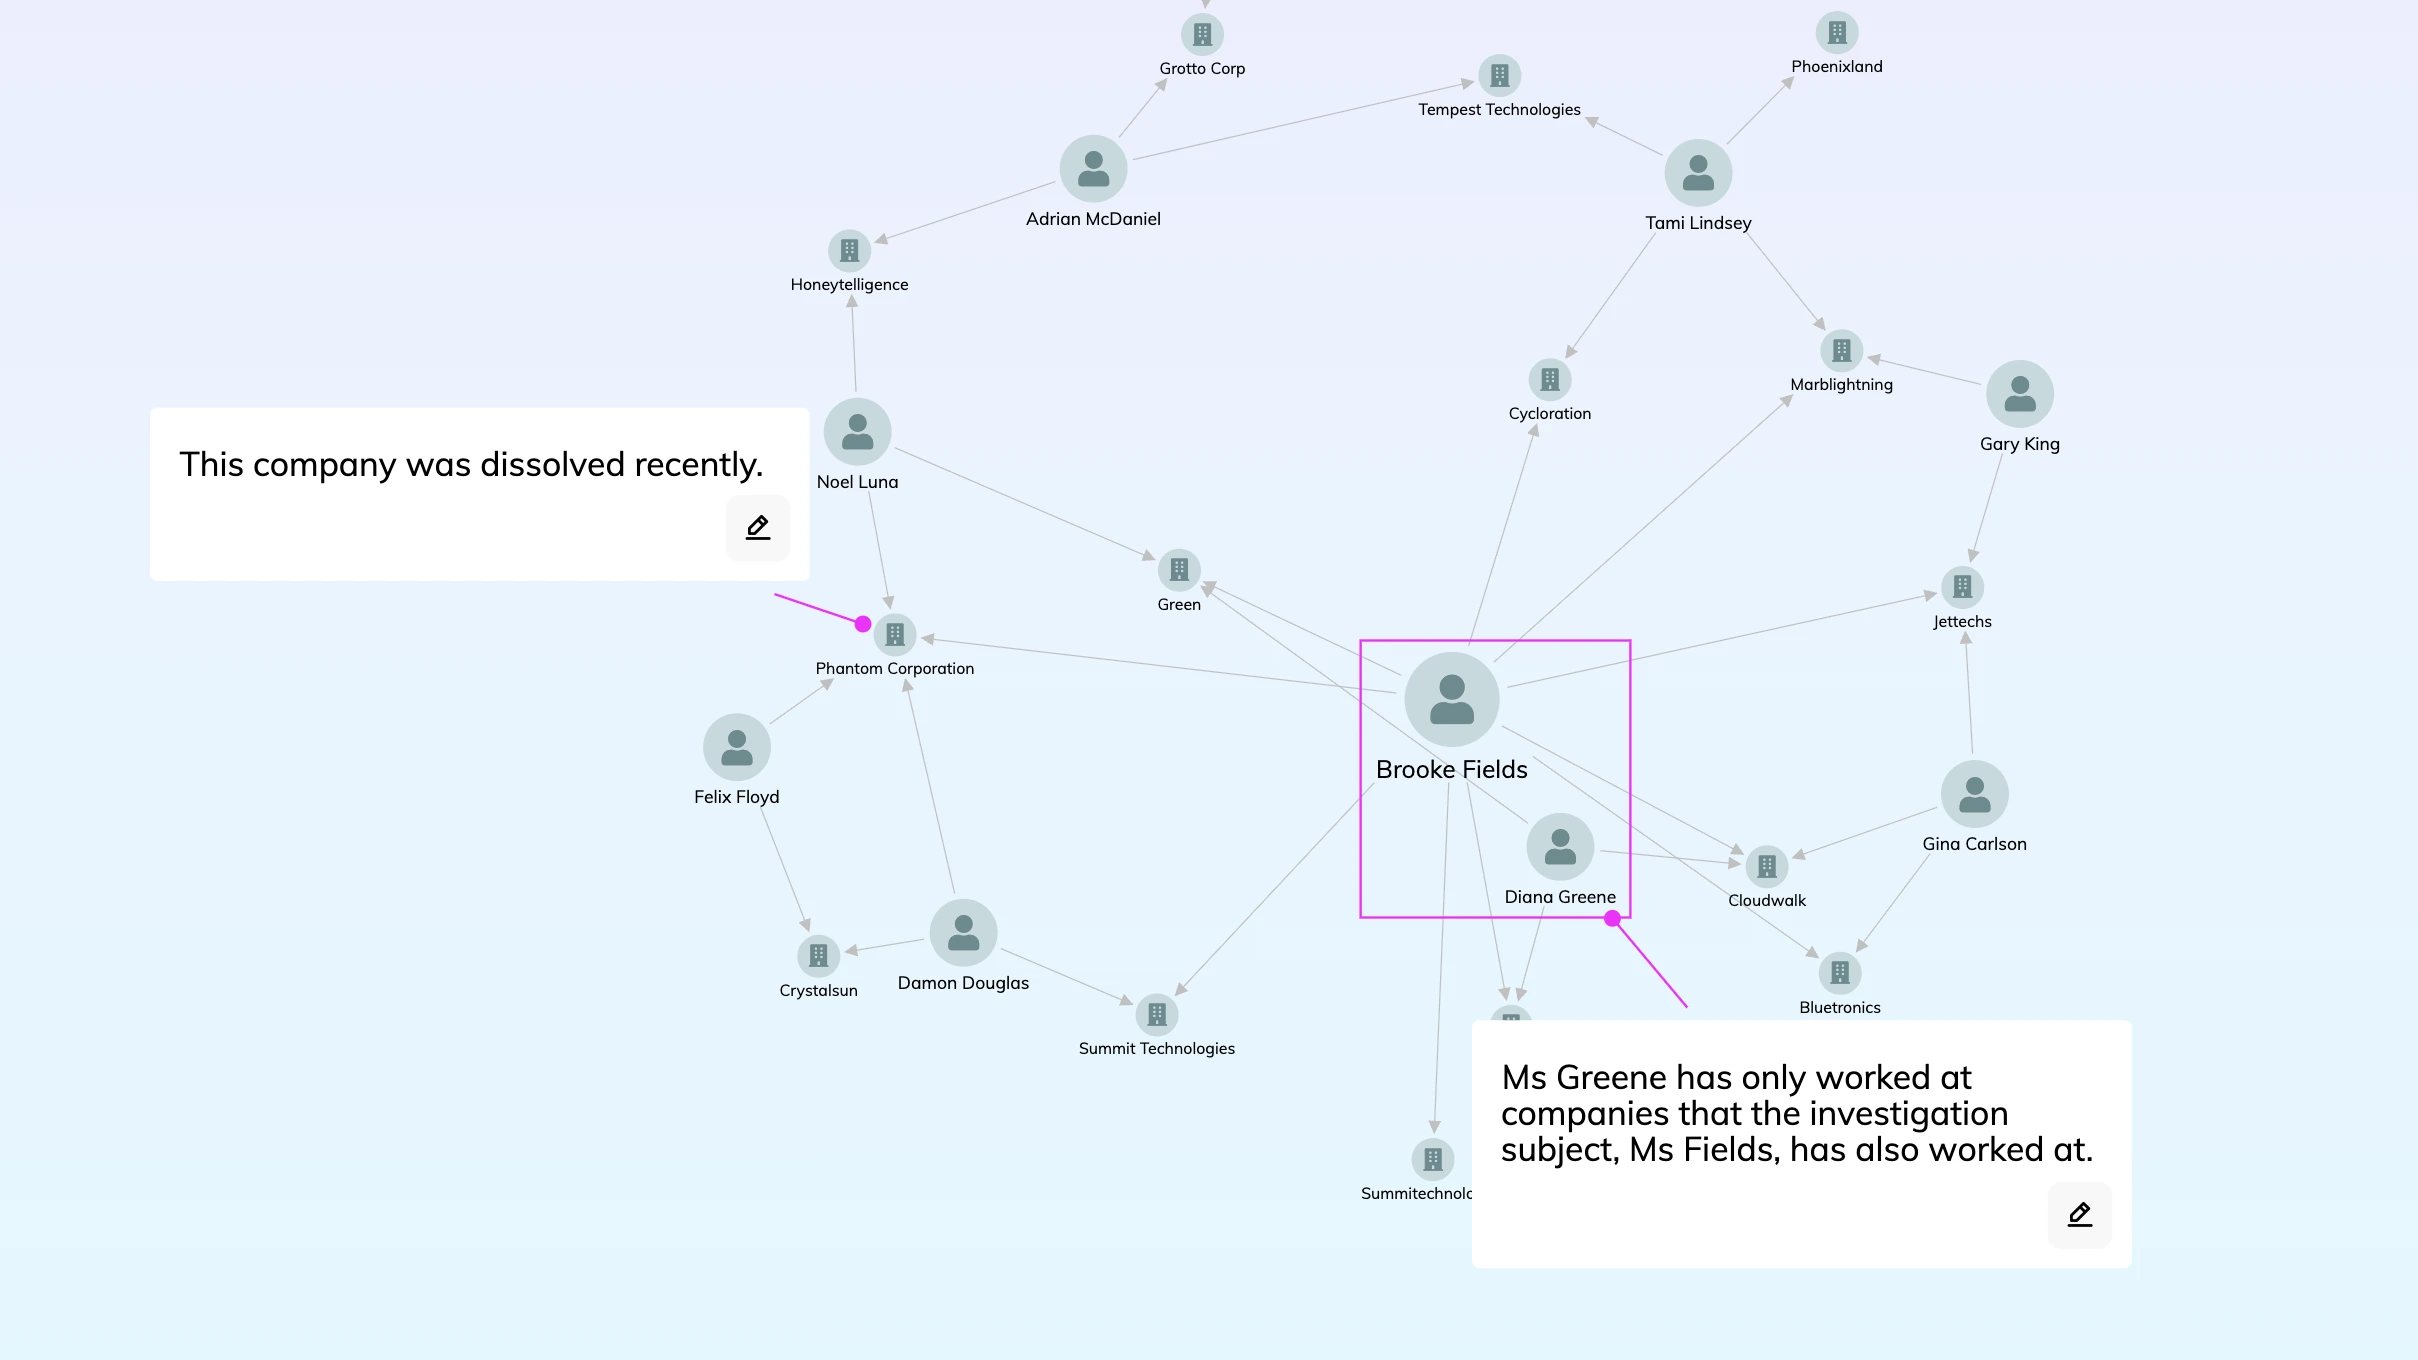
Trusted by leading organizations
From startups to Fortune 500s and national governments.
Meet a few of our customers


We looked at several other visualization options, including open source. KeyLines was chosen because it provided the level of support and documentation we needed. It also had the best performance and the right combination of features to provide that intuitive access to data our users needed.
What is KeyLines?
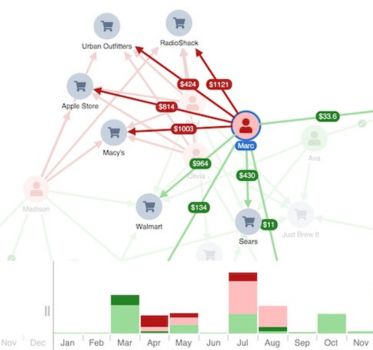
KeyLines is the JavaScript SDK for building interactive graph visualization applications.
It helps developers and analysts reveal relationships in complex connected data, quickly, at scale, and with an intuitive user experience. From cybersecurity and fraud detection to intelligence and security, KeyLines turns networks into answers.
Download white paperWhy teams choose KeyLines
A flexible toolkit that adapts to your tech stack
KeyLines gives your team the freedom to build visualization apps their way.
It fits with any browser, device, server or database and comes with clear tutorials, demos and API documentation.
This flexibility lowers adoption risk and helps teams deliver meaningful results sooner.
Explore our database integrations


Click a logo to find out more
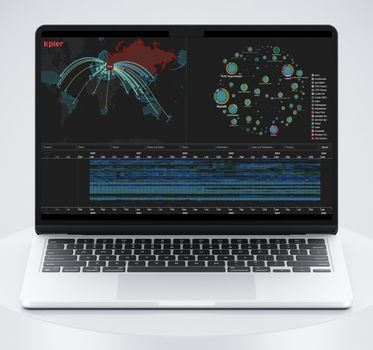
High-performance visualization at any scale
KeyLines makes exploring complex networks fast and responsive.
Its GPU-based rendering handles large graphs with ease, keeping pans, zooms, and layouts smooth even with dense, real-world data.
Performance at this level gives teams the confidence to analyze large-scale datasets without compromise.
Scalable from proof-of-concept to enterprise deployment
KeyLines grows with your needs, from prototype apps to mission-critical deployments.
It’s proven in environments like cybersecurity, fraud detection, and intelligence, where reliability and scale are non-negotiable.
This track record reassures stakeholders that your investment will support both immediate projects and long-term strategy.
Explore use cases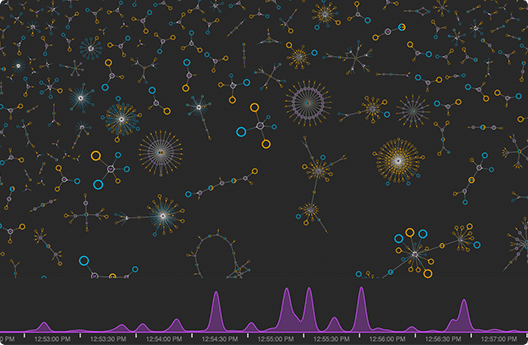
Faster design-to-development workflow
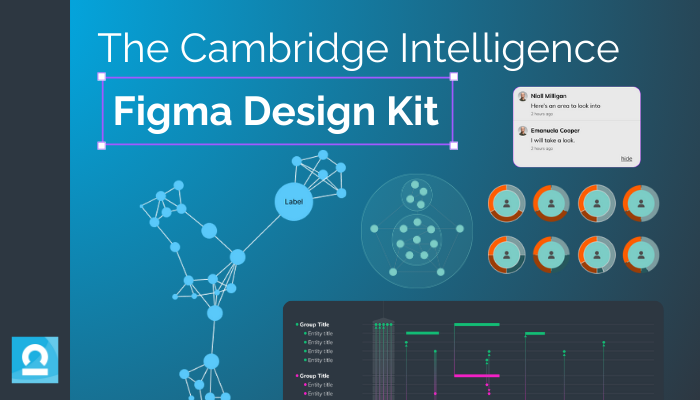
Prototype graph interfaces using our Figma Design Kit before writing a single line of JavaScript. Align designers and developers early, reduce rework, and move from concept to production faster.
Explore the Figma Design KitExpert support from your first login
Every Cambridge Intelligence SDK comes with expert support from day one.
From onboarding to launch and beyond, our team is here to help you succeed.
First-line support comes directly from the developers who build our toolkits, backed by experts who can provide health checks, deep-dive workshops, and guidance tailored to KeyLines.

Want to try KeyLines for yourself?
Advanced graph visualization functionality
Frequently asked questions
Can I try KeyLines before making a purchase?
Yes. We offer a free evaluation license so you can explore KeyLines in your own environment before committing.
What kinds of problems does KeyLines solve?
Organizations use KeyLines to understand complex connected data, from cyber security threats and fraud detection to intelligence and supply chain risk.
Which databases does KeyLines work with?
KeyLines is backend-agnostic and commonly used with Neo4j, Amazon Neptune, Cosmos DB, TigerGraph, JanusGraph, Elastic, and REST/GraphQL APIs.
How is KeyLines licensed?
KeyLines is licensed on a per-application basis. Contact us for a license tailored to your project.
Is KeyLines ISO 27001 certified?
Yes. KeyLines is developed and supported under Cambridge Intelligence’s ISO 27001-certified Security Framework. Learn more on our Security Framework page.
What support is available during evaluation and beyond?
All customers get dedicated support from our technical team, access to robust documentation, and ongoing assistance for production deployments. First-line support comes directly from the developers who build out toolkits, often with a handy playground link to explore.
From the blog
Ready to try KeyLines?
Start building your own graph visualization app with a free trial.
