Product updates: disseminating intelligence
Dan Williams Head of Product Management
4th October, 2021 | 3 min read
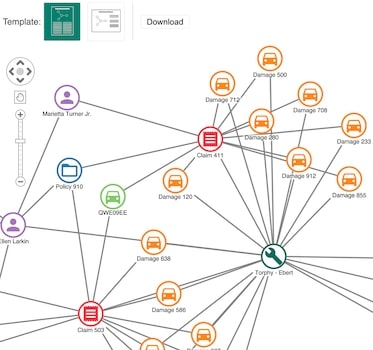
Export charts as PDFs using KeyLines & ReGraph, and add time series charts to KronoGraph timelines to track...
Dan Williams Head of Product Management
4th October, 2021 | 3 min read
Export charts as PDFs using KeyLines & ReGraph, and add time series charts to KronoGraph timelines to track...
Dan Williams Head of Product Management
31st August, 2021 | 3 min read
Find out what’s new in our latest KeyLines & ReGraph releases. Highlights include improved rectangular...
Kevin Naughten Product Manager
15th June, 2021 | 8 min read
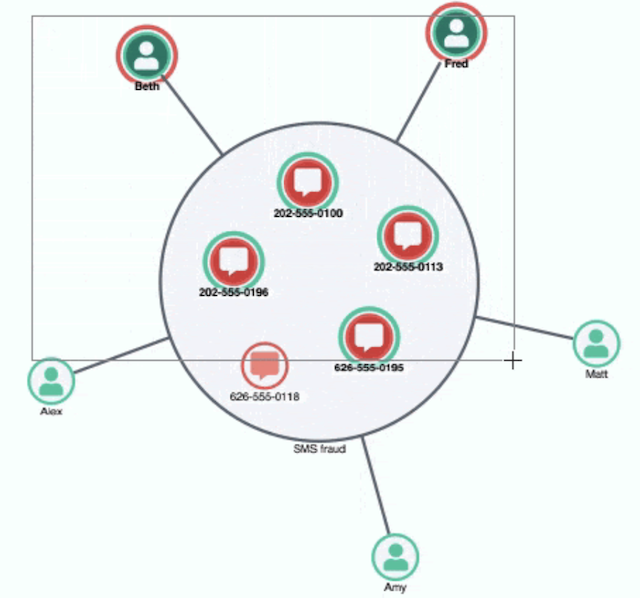
Interactive graph visualization just got easier! These 4 examples show how to customize hover and select behavior...
Catherine Kearns Content Strategist & Team Lead
16th March, 2021 | 3 min read
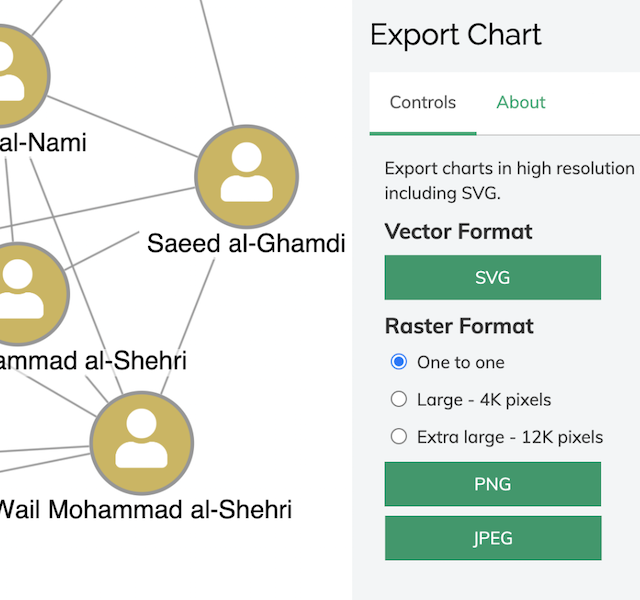
Learn how KeyLines delivers ultra high-resolution chart export (16K) to PNG & JPEG – plus support for...
Dan Williams Head of Product Management
8th December, 2020 | 4 min read
Our latest toolkit updates include rectangular combos, a revised KeyLines Neo4j tutorial, and ReGraph support for...
Dan Williams Head of Product Management
3rd November, 2020 | 3 min read
Our latest graph visualization toolkit update includes clever expand behavior in KeyLines and beautiful curved...
Dan Williams Head of Product Management
22nd July, 2020 | 4 min read
We’re excited to release KeyLines 6.0 – the latest major version of our graph visualization toolkit for...
Dan Williams Head of Product Management
28th October, 2019 | 2 min read
Our October graph visualization toolkit update has two exciting new features for visualizing time-based data....
Dan Williams Head of Product Management
23rd April, 2019 | 3 min read
Version 5.3 delivers the fastest KeyLines yet, thanks to major improvements to our WebGL rendering performance....