FREE: Cloud security visualization white paper
The ultimate guide to understanding complex cloud infrastructure and combating cyber threats using data visualization.
The data landscape is constantly evolving. Over the past decade, we’ve seen a rapid increase in the volume and complexity of digital information, and the diversity of the new technologies that drive it. This presents challenges to investigators working in modern day intelligence operations. How can they uncover insights about crime, threat and malicious activity when they’re hidden in vast silos of complex data? It’s all about simplifying complexity. And for that, investigators need provenlink analysis techniques.
In this blog post we look at six key areas of rapid change, and how successful organizations use link analysis techniques to keep pace. We focus on:
Link analysis helps the human brain understand complex, connected data by leveraging our natural ability to recognize patterns. Our brains are highly visual, so it’s easier for us to understand and analyze relationships if we can see them.
Sometimes called graph visualization, it presents networks of connected entities as nodes and links. For a more in-depth explanation, read our blog post What is Link Analysis?
The explosion of data from sources such as social media, cryptocurrency trading and GPS prompted the development of ever more advanced analytics tools. Here are examples of the scale of these modern-day datasets, visualized using KeyLines, our graph visualization toolkit for JavaScript
Simplifying social networksThe inception of online social media platforms has been both a blessing and a curse for investigators. Social media provides a vast amount of publicly available information that can prove crucial for investigations. But the open source intelligence (OSINT) community is drowning in data. Facebook has over 250 million users in the US at time of writing, and X has a global user base of over 335 million – all of them constantly generating new data.
Here we use a link analysis technique to explore a small fraction of those users and their connections. OSINT analysts can use network visualization to understand social networks, revealing key connections, relationships and interactions.
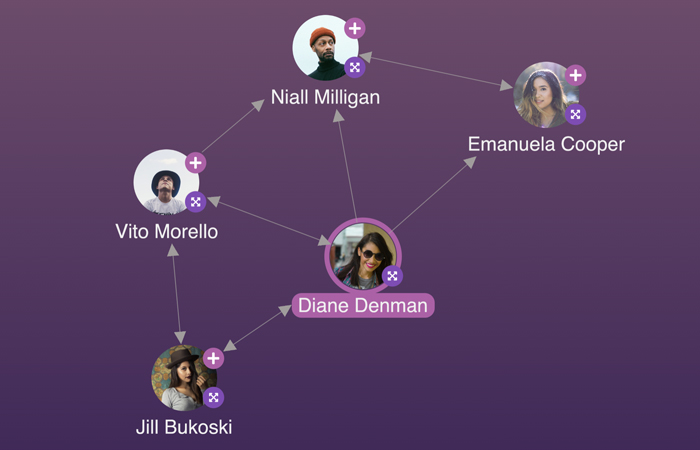
This relationship graph gives us a simplified view of a complex social network. At a glance, we can quickly see connections between persons of interest:
When we interact with the graph to reveal the network of contacts behind each individual, we see that the underlying dataset is much more complex. Each person has a wide network of contacts, hidden neatly behind more grouped nodes, or “combos”:
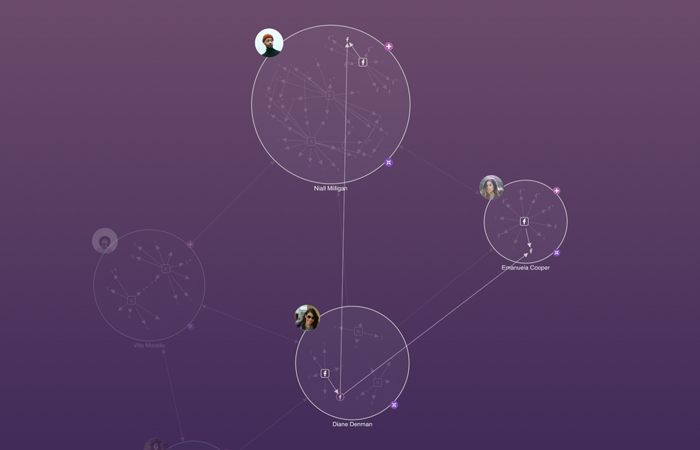
We also see that the relationships aren’t as direct as they first appeared to be, when the layout focused our attention on the key connections that are important to our investigation. Niall is a friend-of-a-friend of Diane, and by extension has a connection to her contact Emanuela. These connections would be incredibly difficult to detect without the clarity and simplification that link analysis brings.
You can take the exploration a step further by using social network analysis (SNA) to get a deeper understanding of your data. Investigators working in anti-terrorism or law enforcement often use centrality measures to understand and measure social networks, revealing how they’re organized, how they behave, and how the nodes inside them interact.
Making sense of money flowIn the financial world, it’s hard to explain where, when and how money is moved. Money flows back and forth across borders, and between accounts. It could be virtual currency, cryptocurrency or traditional cash flow, with illegal activity buried in multiple layers of legitimate transactions.
Link analysis is becoming more and more important as a tool for simplification and data storytelling. It shows you what money is moving, how, where, and most importantly – when.
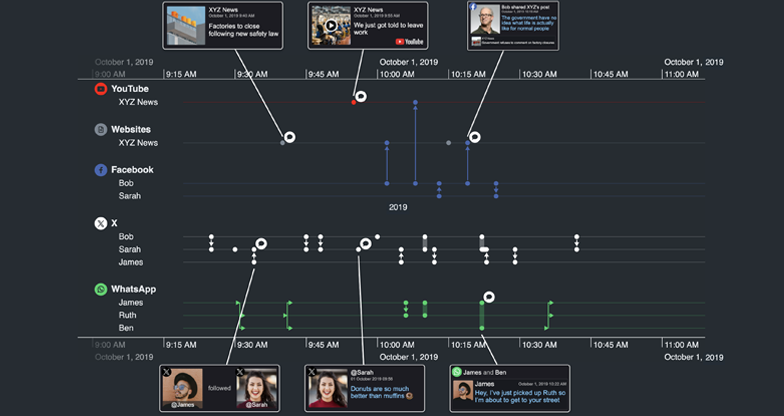
Here’s an example of Bitcoin analysis. This dynamic node-link analysis chart and time bar capture just six minutes of fast-paced, complicated Bitcoin transactions in an intuitive, explorable way:
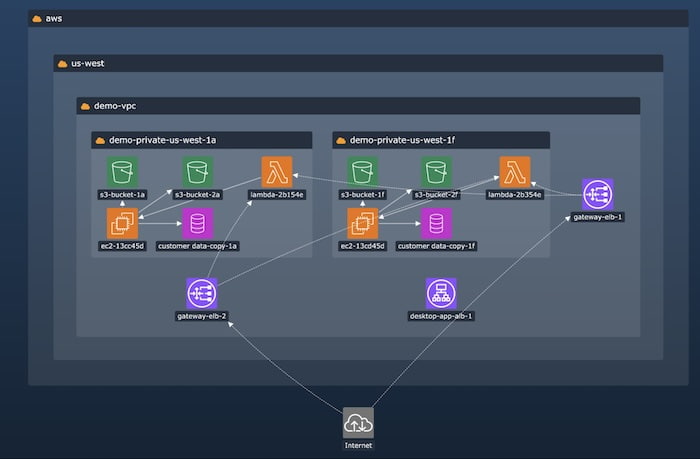
As more companies shift towards Infrastructure as a Service (IaaS), the cyber security challenge becomes harder. The intricacies of cloud infrastructure create new opportunities for unintentional misconfigurations, exposing organizations to malicious attacks or non-compliance with data protection laws.
Intelligence support systems need interactive link analysis to:
Visibility is a big issue with cloud security. You can’t protect assets if you don’t know what you have. Visual representations give analysts the situational awareness and actionable insights they need to keep their cloud network safe.
The ultimate guide to understanding complex cloud infrastructure and combating cyber threats using data visualization.
Today’s cloud-based link analysis tools enable collaboration between stakeholders and international partners, making it simple to instantly share actionable insights, and coordinate decision-making. But workflow isn’t just about presenting information. It’s about fitting in with what your analysts and end users are doing. It’s the same when you’re creating a visualization – you need to think about not only who’s using it, but what they’re doing with it.
An explorable visualization can be invaluable, but insights need to be shareable in the format that suits the recipient. Our graph and timeline visualizations can be exported as a presentation, a report, a high-res image or a link to an interactive chart. Whichever method you choose, a tailored visualization is easy for anyone to understand, even if they are non-technical or unfamiliar with the investigation. Sharing insights this way helps colleagues and stakeholders make well-informed decisions fast. Check out this blog post for tips on preparing a visualization for sharing
Many organizations now use AI and machine learning algorithms to enhance their investigations by automating data analysis, identifying patterns, and predicting potential threats. So does that negate the need for link analysis? Not at all.
Although AI technologies have improved the speed and accuracy of intelligence operations, getting better at detecting threat, spotting anomalies and even recommending courses of action, those alerts and recommendations are worthless without data visualization to make them explainable and understandable to the human decision-maker.
The interface between machines and human investigators has never been more important, and a sound knowledge of link analysis techniques is essential for communicating AI-driven insights in a way that supports human decision-making.
Read more about the AI and data visualization challenge
Every day, we see changes in the threat landscape, and in the technologies and types of data we’re trying to protect. Cyber attacks have become more sophisticated and frequent, and alert fatigue is a growing problem.
There’s no shortage of software that detects threat and gives analysts information about what’s going on in their systems, but clear communication is key to a successful investigation.
Complex and relentless cyber threat needs to be simplified and communicated to busy analysts who need fast and reliable intelligence on what and where the problem is, so they can make a well-informed decision on what to do next.
Real-time link analysis is simple and effective with a cybersecurity dashboard powered by timeline visualization. It gives intelligence agencies the fast situational awareness they need to triage complex alert data.
With the parallel growth of social networks and AI technology comes a new level of weaponized misinformation and disinformation, compromising the accuracy of link analysis. Anyone from governments and protest groups to news outlets and individual disruptors can exploit the latest AI technologies to generate harmful content and spread it widely and rapidly via global social media platforms.

Link analysis is keeping pace, with new graph-powered tools that make it easier to detect and stifle mis/disinformation. Graph and timeline visualization lets investigators uncover connections, spot trends and patterns of malicious behavior, and understand the intent of false information to make quick, reliable decisions.

Find out how data visualization and AI technology helps to keep us safe from false online content.
We’ve seen how the data landscape is keeping analysts and investigators ever-vigilant to technological advancements and evolving threats. Link analysis has adapted to these shifts by integrating advanced data visualization technologies that promote collaboration without borders, often leveraging AI for faster insights.
If you’re curious to find out how easy it is to bring advanced data visualization into your link analysis project, request a free trial today
Registered in England and Wales with Company Number 07625370 | VAT Number 113 1740 61
6-8 Hills Road, Cambridge, CB2 1JP. All material © Cambridge Intelligence .
Privacy Policy | Security Framework


