We hear a lot of success stories about how graph theory can make stunning predictions, from recommendation engines for shopping websites to fraud and criminal investigation. So this week we decided to put it to the test on something that really matters – who is going to win the 2018 FIFA World Cup?
We’re down to the last 16 teams, so we’ve got a one in sixteen chance of getting it right. That’s got to be worth a shot!
Step 1: Load the data
The starting point is a dataset, and in this case we’ve used a dataset scraped from Wikipedia by Paul Campbell. This data simply links players to the club sides they play for, and tells us which country they hail from. Perfect for graph analysis – thanks Paul.
The next step was to load the dataset into our visualization application, and add a bit of color. The model we went for is as simple as this:

Step 2: Unleash the power of combos
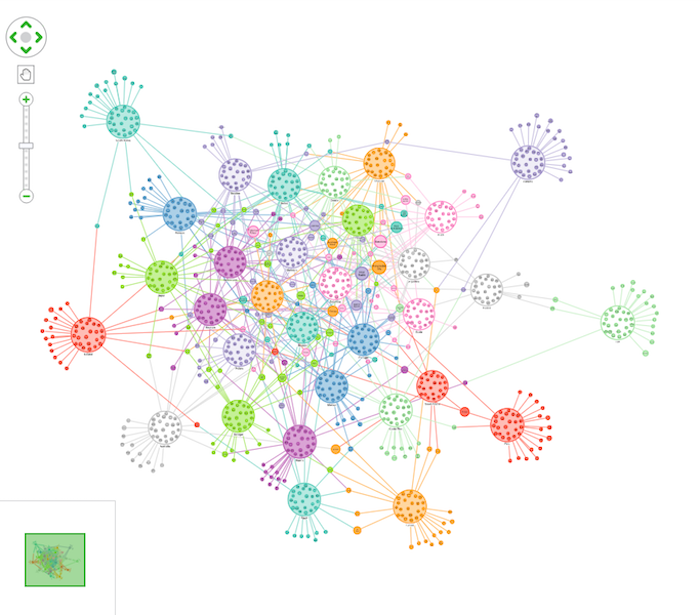
There’s absolutely no information about how good a player is, or how good their club sides are. Just who plays for which team. Not enough, you’d think, to get us close to predicting a winning country. But when we bring it all together, and use a bit of Cambridge Intelligence product magic to group players by their country into circular combo nodes this is what we get:

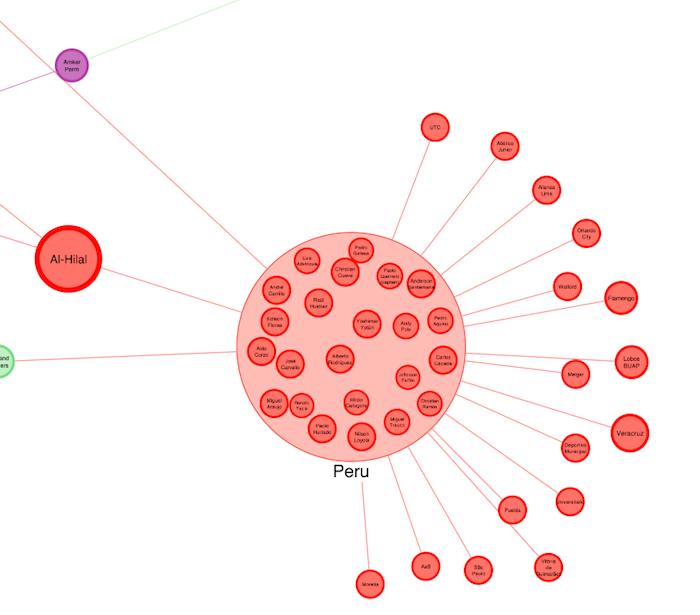
Notice anything? Well, for a start, some of those countries have a lot of what graph theorists might call ‘leaf nodes’ – nodes that are not connected to anything else. Here’s Peru, for example:

This shows that most of Peru’s squad play for local clubs who don’t have any other world cup players in their side. Probably not good for Peru, and sure enough they didn’t make it past the group stage.
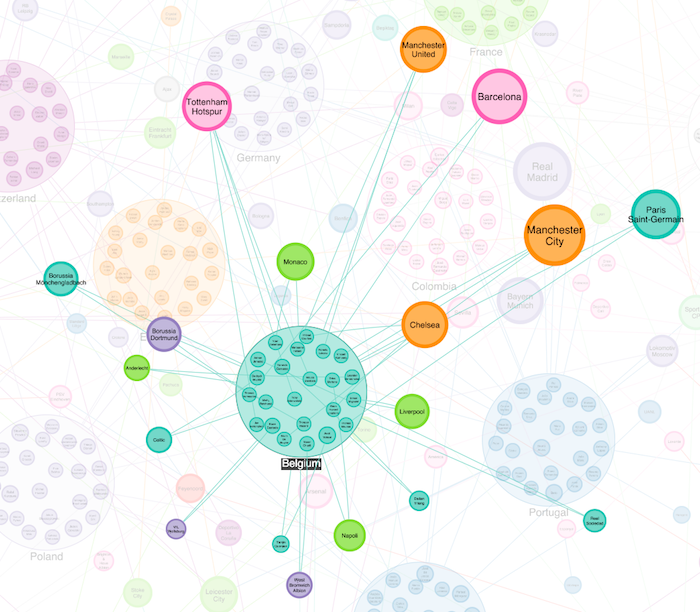
Belgium, on the other hand, have an incredible squad of players who compete in the English, French, German, Italian and Spanish top league teams, and those teams boast many other international legends.

So what makes Belgium more ‘interesting’ from a network point of view than Peru? In graph theory, we have a word for this: centrality.
Step 3: Predict the winner using centrality
Centrality is a measure of how central a node is to the rest of the network, and by ranking World Cup sides by their centrality score, we might have a shot at predicting the winners. Let’s try…
The first step is to choose a measure. There’s more than one kind of centrality. Degree centrality, for example, counts the number of edges or links from a node and uses that to score the node. That one’s certainly not going to work here – every team has 23 players in their squad so every country will have a degree centrality of roughly 23, if our dataset is accurate.
We need something that looks at the bigger picture, and one such measure is Eigenvector Centrality. Simply put, it scores each node based on the number of connections, and it weights those connections based on how well-connected the nodes at the ends of those connections are… and so on. In Peru’s case, there’s not much “and so on”, but for other teams they will gain importance the more important their connections are.
What does that mean in footballing terms? It means that countries who have players who play for clubs who themselves have many players who are good enough to play for good countries who boast other good players… Well, you get the idea. All that recursion means we roll up a huge amount of information about the network in one score.
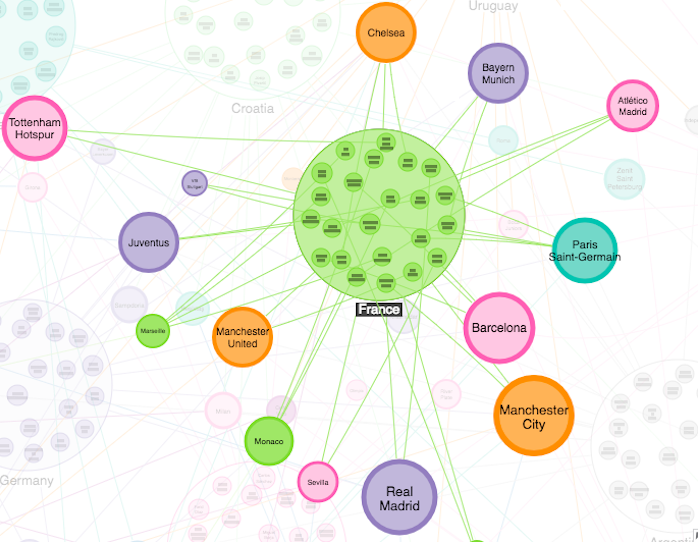
So, we asked our graph visualization toolkit to calculate the Eigenvector Centrality of the clubs in our combined network, and rank them by score. The top five are, from top to bottom:
- France
- Belgium
- Germany
- Argentina
- Croatia
Not even graph theory managed to predict Germany’s shock defeat this week, but the other four teams made it to the last sixteen, which is not bad considering we’ve made this prediction with absolutely no data on how good a player or a team is, the difficulty of the first round groups they were placed in, or the unpredictability of the new ‘Video Assistant Referee’ in this year’s tournament.
Nope, this is entirely based on networks – the links which tell us which clubs have signed which players. We don’t even have data on how successful those clubs are – but the magic of eigenvector centrality is that we can infer how successful they are just by their ability to buy players who themselves are connected to high scoring countries.
There you have it. If you want to back graph theory (and who wouldn’t?), then you should be getting behind France this year. Allez les bleus!


