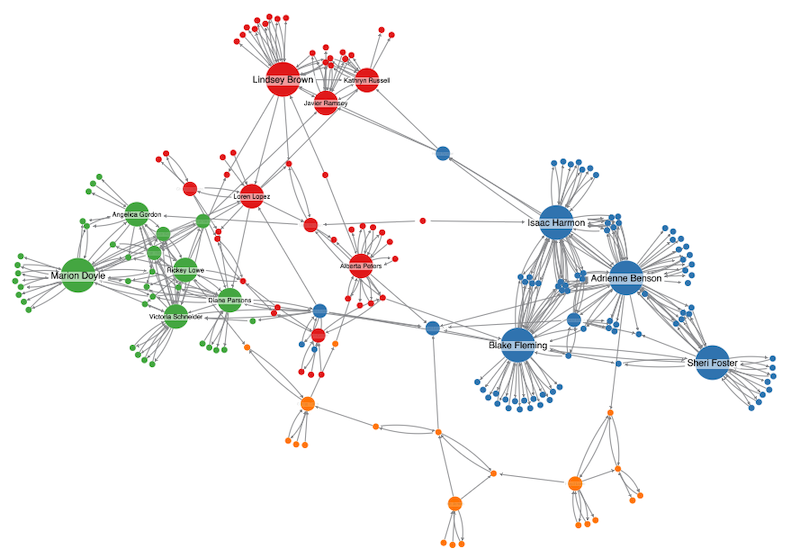
Graph visualization is undoubtedly the most powerful, intuitive and flexible way to extract valuable insight from your complex connected data. But sometimes graphs have the nasty habit of growing out of control. Use the wrong tools and you could quickly see your visualizations growing in scale and complexity, overwhelming the user.
Happily for developers using KeyLines, our JavaScript graph visualization toolkit and ReGraph, our React toolkit, we’ve built a set of graph analysis and visualization functionality to cut through noisy data.
In this series of blog posts, we’re exploring the toolkits’ social network analysis measures, and how they help bring big and complex graph data down to a user-friendly, insightful scale.
Last time saw how EigenCentrality and PageRank reveal the most influential or important nodes in a network. This time, we’ll see how network clustering helps identify community structures.

Our clustering algorithm is a careful balance of speed and quality, identifying communities, or sub-networks, in your graph data. Let’s take a closer look.
What is clustering?
To understand clustering, we need to understand a graph concept called modularity.
Modularity is a way to measure how readily a network can be divided into sub-networks, which we call modules.
A high modularity score means there are tightly-connected modules, with lots of links between the nodes but few links connecting the wider modules. A low modularity score indicates sparsely-connected modules – meaning distinct modules are hard to find as there’s a relatively even distribution of links between nodes in the network.
How do we calculate modularity?
In our graph visualization toolkits, we calculate modularity as the fraction of the links whose ends fall inside a group, minus the expected fraction if links were distributed at random. This gives us a score between 0 and 1.
For example, if we imagine a network with 100 nodes and 200 links. If one cluster has 25 nodes and 100 links – i.e. a quarter of the nodes, but half of the links – the modularity would be ½ -¼ = ¼.
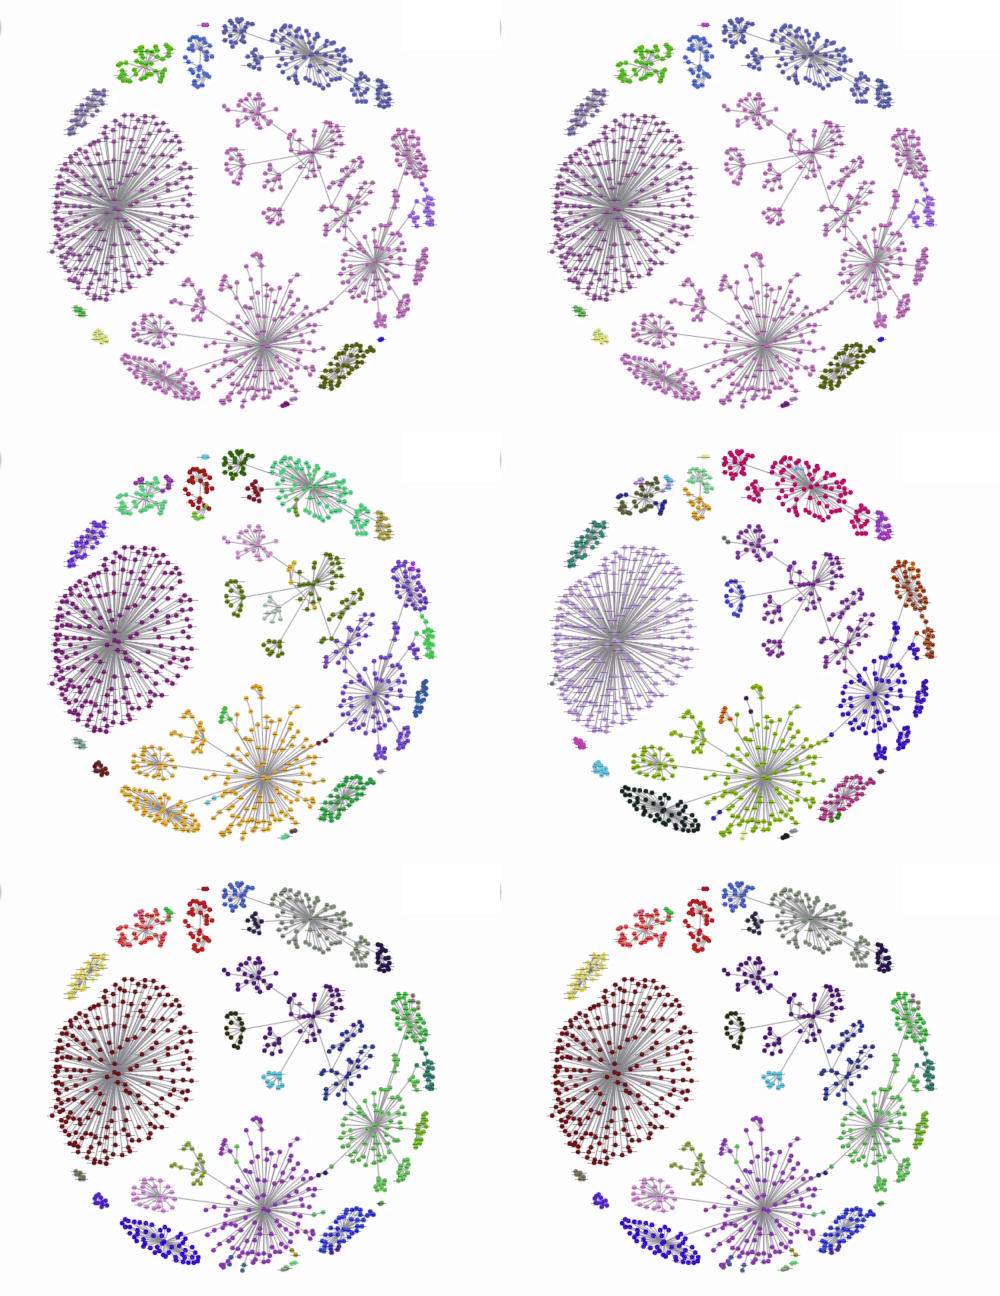
Our clustering algorithm works by finding the best network partitions to minimize the modularity score. When the algorithm first starts, it takes each node as a cluster. We then run through every permutation by moving nodes into clusters, keeping the configuration if the modularity score improves.
The result is ‘optimal’ partitions for different numbers of modules:

This approach works well for both connected graphs, where every node and sub-network is connected together, and disconnected graphs, where there are distinct sub-networks with no connection to the rest of the graph. You can also take link weightings into account, so some connections are more ‘important’ than others.
Why is network clustering useful?
Uncovering communities is a great source of graph insight. It’s not limited to networks of people, either.
In the Cyber security threat detection domain, studying clusters helps model network behavior and impact. For example, malicious software will propagate more quickly through a dense community than a sparse one.
Law enforcement and security agencies often need to uncover organizational structures from complex communications meta-data. Clustering algorithms make it much easier to find communities learn more about the organizations being investigated.
Fraud investigators and analysts also use clustering to help shut down the biggest and most damaging organized fraud rings.
Try it for yourself
Of course, these three use cases are just a tiny fraction of the potential ways clustering can help you find insight into your complex connected data. Request a free trial of our graph visualization toolkits to see clustering in action.


