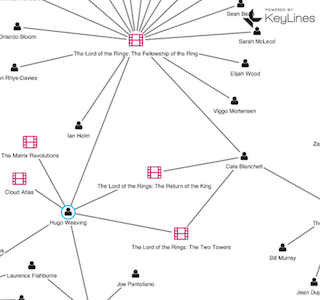
Visualizing JanusGraph: the new TitanDB fork
Andrew Disney Marketing Director
4th December, 2017 | 5 min read
A quick history lesson Back in February 2015, Aurelius – the organization behind the Titan graph database...
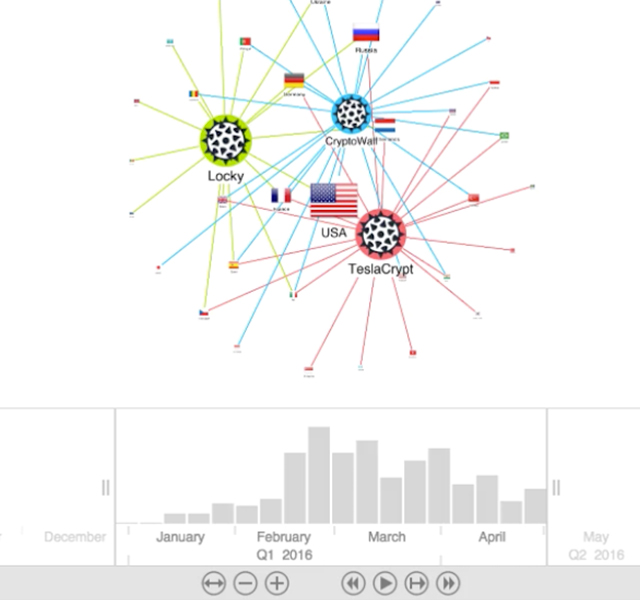
Make sense of cyber threats with graph technologies
Andrew Disney Marketing Director
12th May, 2017 | 5 min read
This post explores how KeyLines graph visualization simplifies complex Malware networks, making post-attack...
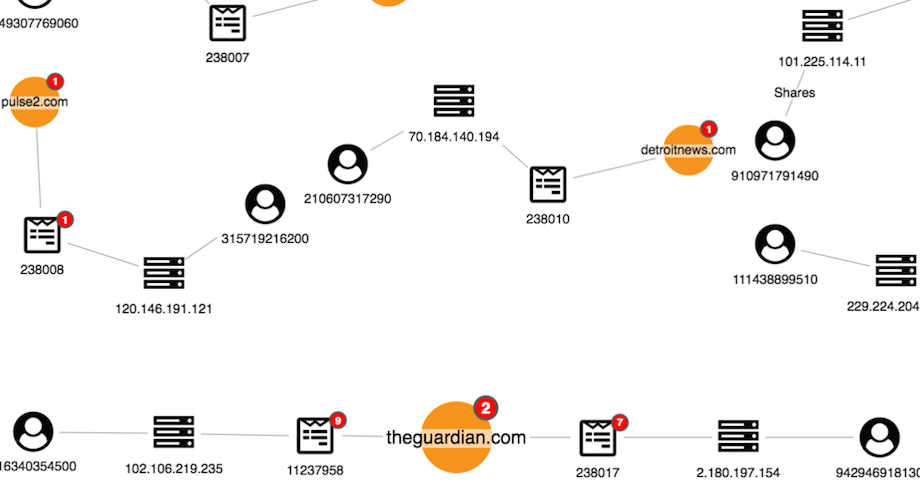
Visualizing anomaly detection: using graphs to weed out fake news
Andrew Disney Marketing Director
28th February, 2017 | 8 min read
Fake news is nothing new – bad journalism and propaganda have always existed – but recent concerns about its...
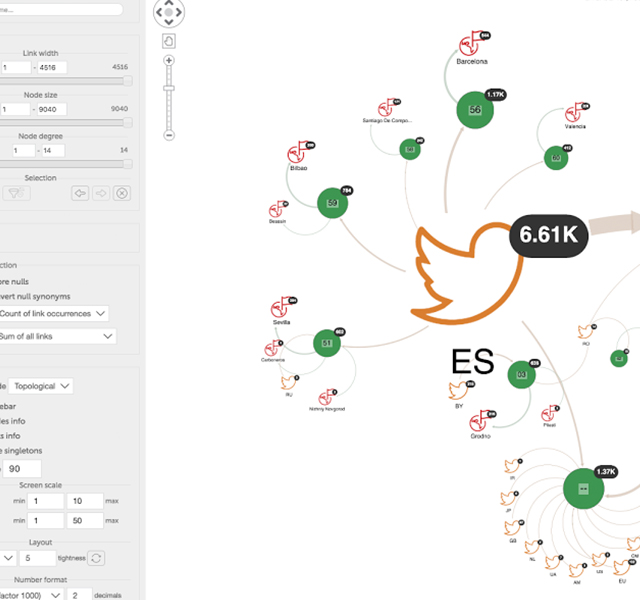
Devo: Democratizing real time big data
Andrew Disney Marketing Director
21st February, 2017 | 4 min read
We’ll explore how Devo empowers analysts to harness the connections in their big data, with the help of the...
How to use font icons in your KeyLines application
Andrew Disney Marketing Director
30th January, 2017 | 5 min read
Font icons are web font files made up of symbols and icons. Learn how to use them in your KeyLines graph...
Microsoft choose KeyLines for new police platform
Andrew Disney Marketing Director
10th January, 2017 | 4 min read
Identifying Threat, Risk & Harm KeyLines has been incorporated into a new Microsoft Services platform for UK...
KeyLines FAQ: The Graph Engine
Andrew Disney Marketing Director
3rd January, 2017 | 2 min read
In this FAQ blog post, we’ll take a closer look at the KeyLines Graph Engine to understand what it is and how it...
Enterprise fraud detection
Andrew Disney Marketing Director
15th November, 2016 | 6 min read
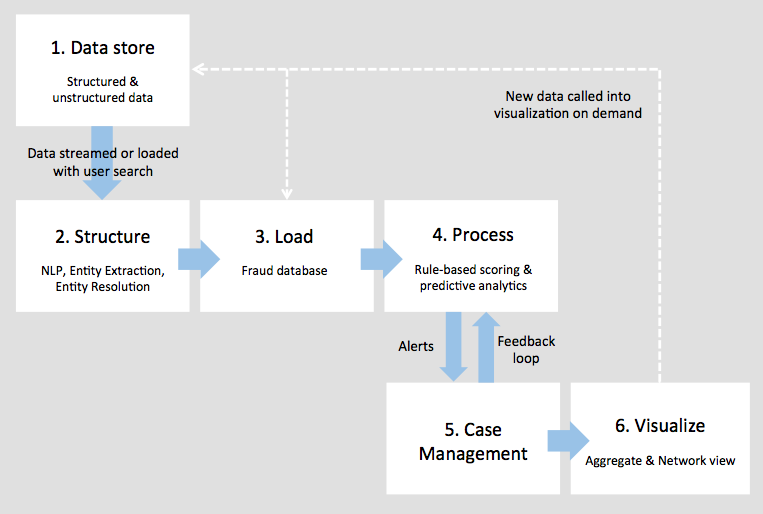
The best fraud detection processes use the right tools at every stage. Find out how important KeyLines and link...
Integrating ReactJS with the KeyLines toolkit
Andrew Disney Marketing Director
8th September, 2016 | 4 min read
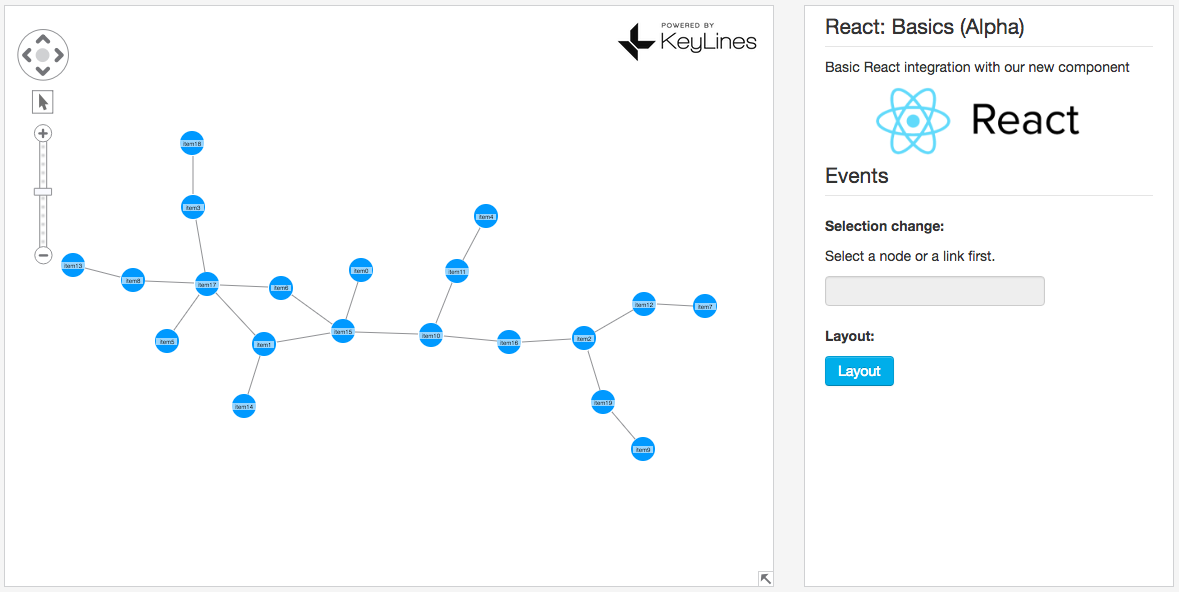
If you can’t use ReGraph, our graph visualization toolkit for React developers, find out how to integrate...
