
CDVC: shaping the future of connected data visualization
Dan Williams Head of Product Management
3rd April, 2018 | 2 min read
We welcomed fellow specialists in the field of graph visualization to discuss the future of connected data...
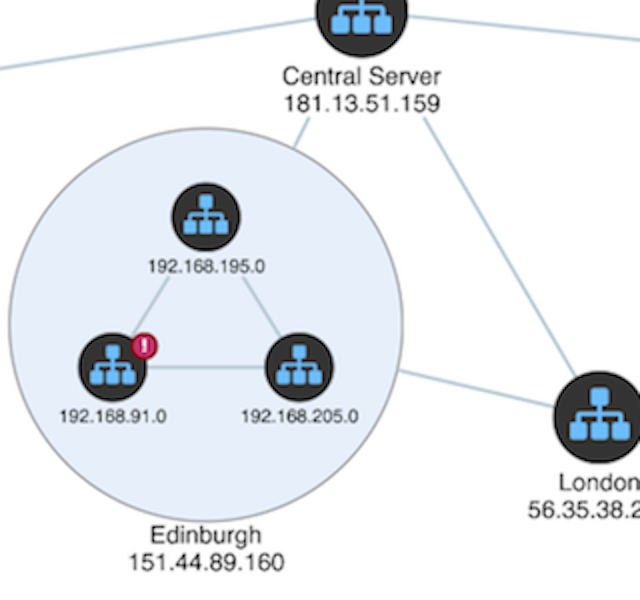
Network alert and network topology visualization
Dan Williams Head of Product Management
12th March, 2018 | 5 min read
In this blog post, we’ll show you how network visualization can make alert detection and investigation more...
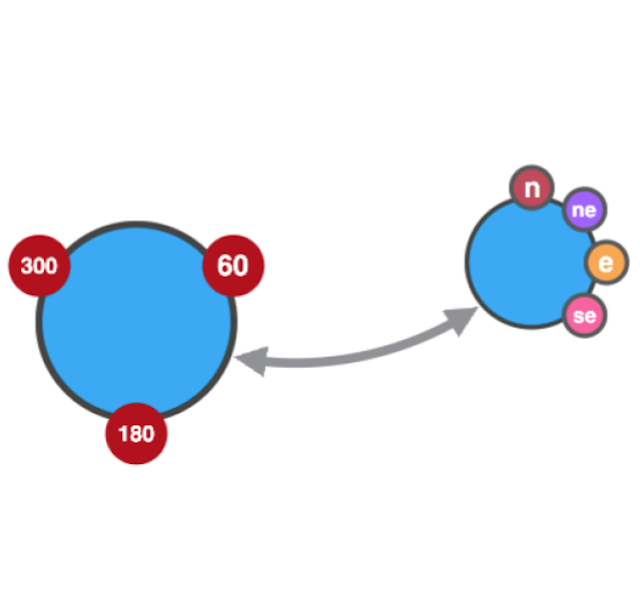
KeyLines 4.1 – Glyphs galore
Dan Williams Head of Product Management
27th February, 2018 | 2 min read
KeyLines 4.1 is now available to all KeyLines customers and evaluators, with some slick enhancements you can start...

Open source graph visualization: is this the right option for your project?
Dan Williams Head of Product Management
9th February, 2018 | 5 min read
In this blog post we explore open source code libraries versus commercial SDKs to show why Cambridge...

CDVC gets off to a flying start
Dan Williams Head of Product Management
16th October, 2017 | 2 min read
Last week, we welcomed some of Europe’s leading graph visualization practitioners to the launch of the...
Help us shape the future of connected data visualization
Dan Williams Head of Product Management
4th September, 2017 | 2 min read
This page is from our blog archive It’s still useful, but check out the Connected Insights series for more...
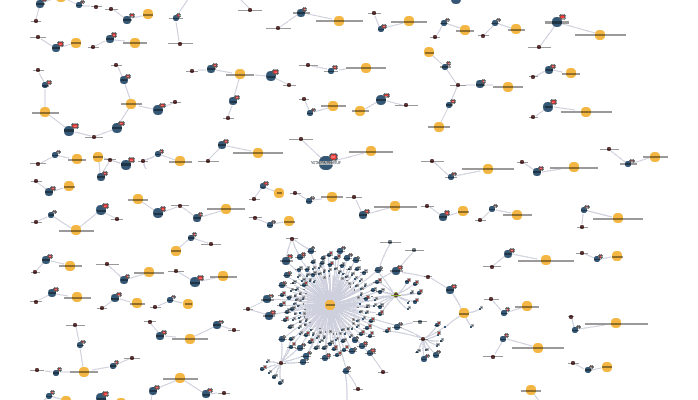
Visualizing restricted substances for REACH compliance
Dan Williams Head of Product Management
13th June, 2017 | 6 min read
Using connected data visualization techniques to manage supply chain risk, ensure restricted substance compliance...
Angular graph visualization with KeyLines
Dan Williams Head of Product Management
8th May, 2017 | 5 min read
How to get started with KeyLines and Angular. Build your own advanced graph visualization app using the KeyLines...