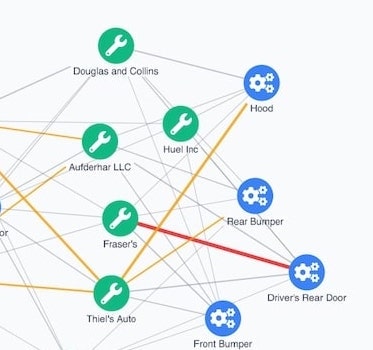
Tailwind CSS tutorial for graph visualization
Ivan Krushkov Commercial Development Lead
16th December, 2025 | 12 min read
In this Tailwind CSS tutorial, we’ll show you how to customize your ReGraph app and achieve the designs you want...
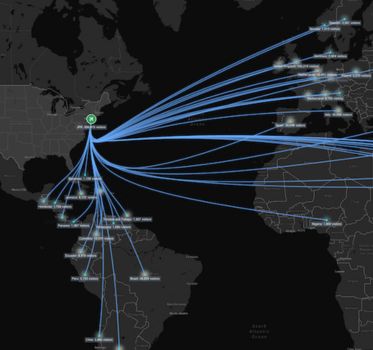
Advanced Mapbox data visualization with graph analysis
Ivan Krushkov Commercial Development Lead
19th June, 2025 | 13 min read
If you’re already using Mapbox for data visualization but need to reveal the hidden connections and...
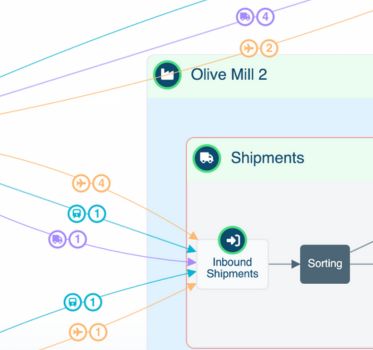
Data visualization, AI and supply chain
Ivan Krushkov Commercial Development Lead
7th May, 2024 | 10 min read
Transform your supply chain processes by integrating graph and timeline visualization with the latest AI-led...
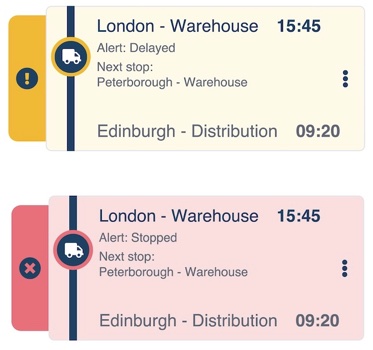
Design a visual supply chain where every node tells a story
Ivan Krushkov Commercial Development Lead
9th August, 2023 | 8 min read
In this post, I show how easy it is to design a visual supply chain that’s customized to your users’ needs,...
