Graph visualization: the basics
Catherine Kearns Content Strategist & Team Lead
21st April, 2020 | 15 min read
A non-technical, high-level introduction to graphs, graph models, graph databases and graph...
Catherine Kearns Content Strategist & Team Lead
21st April, 2020 | 15 min read
A non-technical, high-level introduction to graphs, graph models, graph databases and graph...
Dan Williams Chief Product Officer
6th April, 2020 | 7 min read
The first step in the data cleansing process is understanding where data quality issues exist. In this blog post...

Dan Williams Chief Product Officer
20th January, 2020 | 8 min read
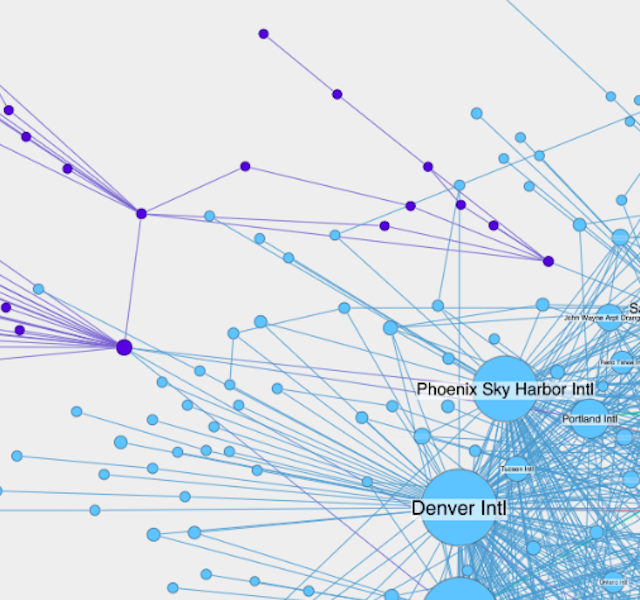
A starburst is when one heavily connected node dominates your graph visualization. It’s a common problem...
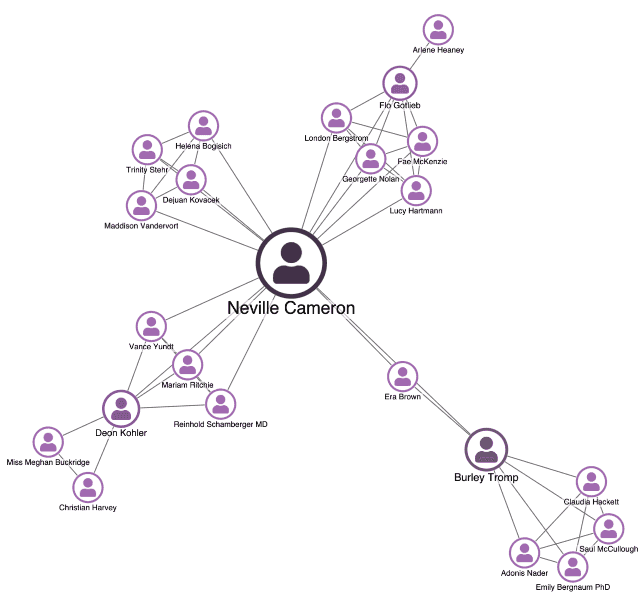
Andrew Disney Marketing Director
7th January, 2020 | 8 min read
Are you trying to create effective data models for graph visualizations? Do your users find insight in connected...

Dan Williams Chief Product Officer
16th December, 2019 | 7 min read
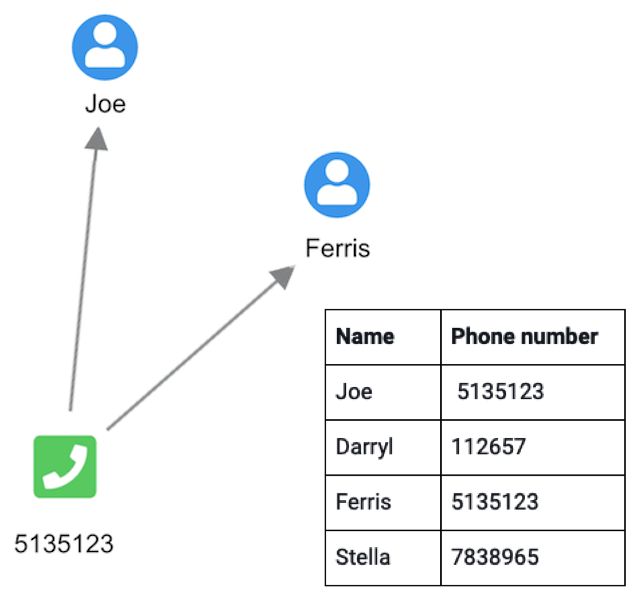
When you visualize data from spreadsheets and relational databases, how do you prevent the ‘snowstorm’...

Dan Williams Chief Product Officer
25th November, 2019 | 6 min read
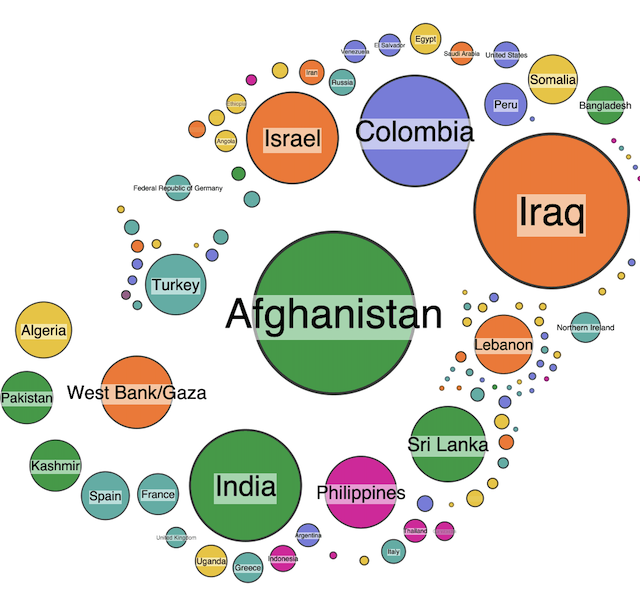
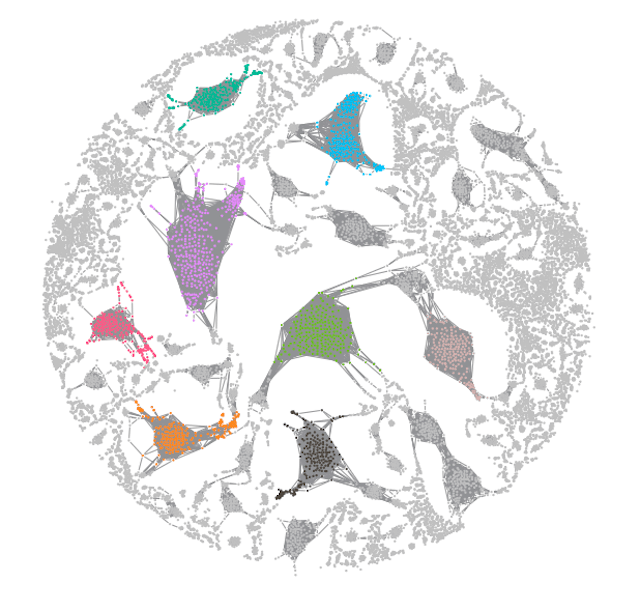
Learn how to tackle the hairballs in your graph visualizations, where nodes and links are so densely connected you...
Kevin Naughten Senior Product Manager
15th July, 2019 | 6 min read
Let’s create visual models that deliver the best user experience (UX). Detailed graph visualizations from an...
Dan Williams Chief Product Officer
17th June, 2019 | 5 min read
How to build great graph visualization tools that fit seamlessly inside your existing applications, matching...
Dan Williams Chief Product Officer
21st September, 2018 | 8 min read
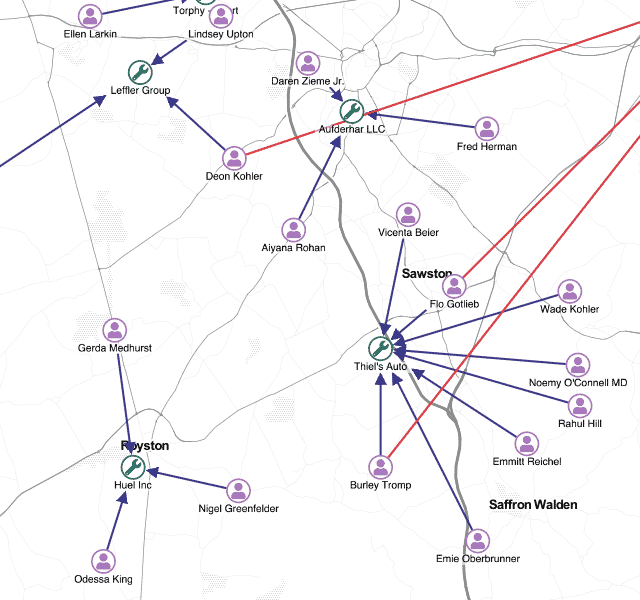
A step-by-step guide to understanding and visualizing very large graph datasets using our ReGraph & KeyLines...
Registered in England and Wales with Company Number 07625370 | VAT Number 113 1740 61
6-8 Hills Road, Cambridge, CB2 1JP. All material © Cambridge Intelligence .
Privacy Policy | Security Framework
