
Data visualization and AI: Powering the intelligence cycle
Dan Williams Chief Product Officer
6th February, 2024 | 8 min read
Data visualization and AI are transforming the intelligence cycle. But AI-driven insights need to be tempered by...
Dan Williams Chief Product Officer
6th February, 2024 | 8 min read
Data visualization and AI are transforming the intelligence cycle. But AI-driven insights need to be tempered by...
Corey Lanum Chief Product Evangelist
14th November, 2023 | 15 min read
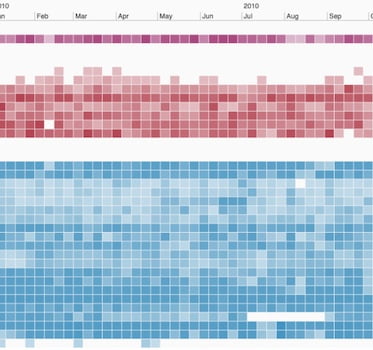
In this tutorial, you’ll find out how to use Neo4j and KronoGraph to create an interactive timeline...
Corey Lanum Chief Product Evangelist
25th October, 2023 | 12 min read
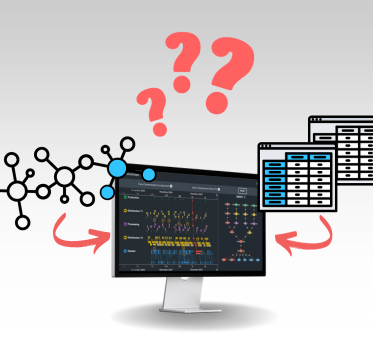
What datastore is best for visualizing graph data? Graph databases are often a great fit, but you have more...
Ivan Krushkov Commercial Development Lead
9th August, 2023 | 8 min read
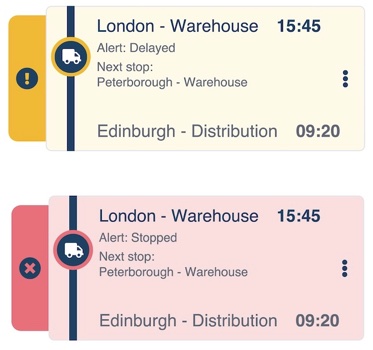
In this post, I show how easy it is to design a visual supply chain that’s customized to your users’ needs,...
Christian Lentfort Developer
14th February, 2023 | 11 min read
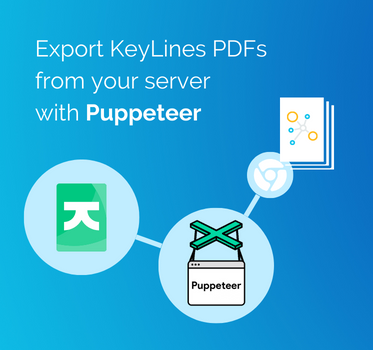
In this Puppeteer tutorial, developer Christian Lentfort shows you how to create a simple server application using...
Kevin Naughten Senior Product Manager
2nd December, 2022 | 10 min read
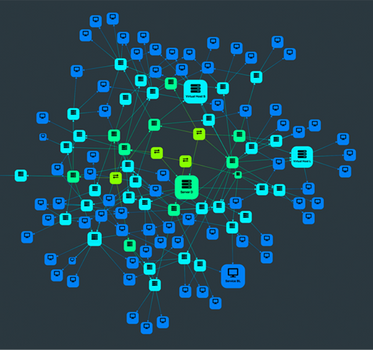
Bring the perfect graph visualization design to life: our KeyLines and ReGraph SDKs offer almost infinite...

Corey Lanum Chief Product Evangelist
25th October, 2022 | 11 min read
Graph visualization is a serious business. But there’s no denying that graphs can also be fun. In this blog...
Dan Williams Chief Product Officer
16th August, 2022 | 8 min read
Want to know how to do timeline data modeling? We explore best practices with real-world examples of the best...
Andrew Disney Marketing Director
7th March, 2022 | 8 min read
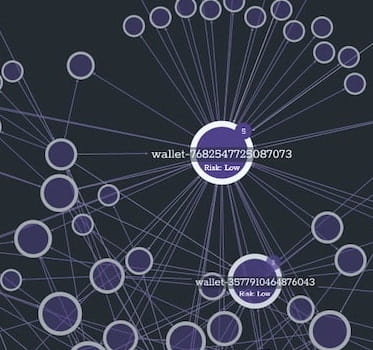
Follow these techniques to build a blockchain analysis tool and make sense of vast & complex blockchain data...
Registered in England and Wales with Company Number 07625370 | VAT Number 113 1740 61
6-8 Hills Road, Cambridge, CB2 1JP. All material © Cambridge Intelligence .
Privacy Policy | Security Framework
