Graph visualization UX: Designing intuitive data experiences
Zach Mason Product Designer
24th June, 2025 | 18 min read
We share expert graph visualization UX principles that make the difference between user frustration and...
Zach Mason Product Designer
24th June, 2025 | 18 min read
We share expert graph visualization UX principles that make the difference between user frustration and...
Courtney Collins Product Manager
13th May, 2025 | 3 min read
From sleeker animations to richer styling and smoother interactions, these updates help you create visualizations...
Clare Haynes Product Designer
4th February, 2025 | 3 min read
Good user experience (UX) design is the foundation of a successful data visualization experience. It lets users...
Courtney Collins Product Manager
10th January, 2025 | 6 min read
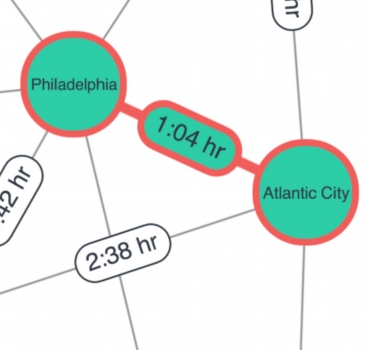
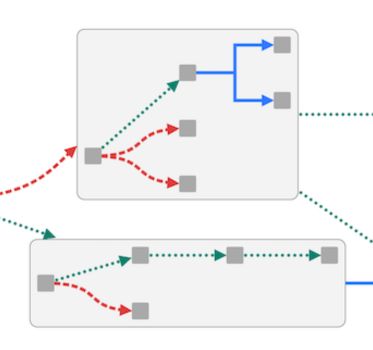
The way you represent relationships between nodes can make or break your link visualization. The link styles you...
Courtney Collins Product Manager
3rd December, 2024 | 3 min read
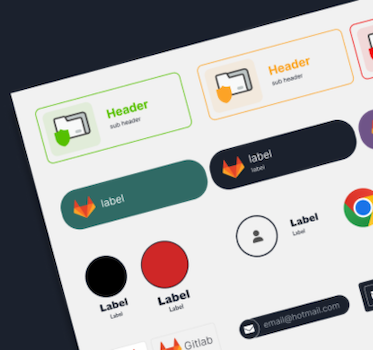
The latest versions of our graph visualization toolkits bring new link options that make it easier than ever to...

Jan Girman Product Manager
19th November, 2024 | 12 min read
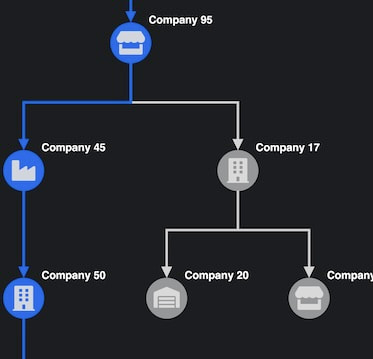
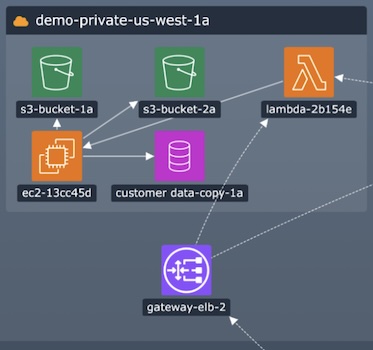
This blog post explores how graph visualization brings digital twins to life. Before joining Cambridge...

Courtney Collins Product Manager
22nd October, 2024 | 9 min read
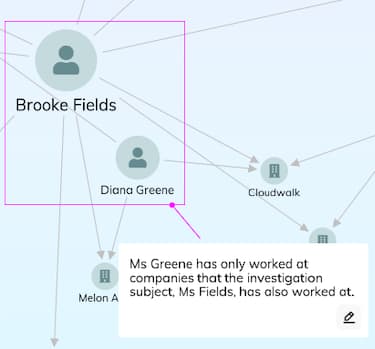
At every stage of an investigation workflow, the analysts need to understand the underlying story – or...
Courtney Collins Product Manager
15th October, 2024 | 4 min read
Get ready to tell the story of your complex data – our latest major releases mark a big leap forward in the...
Dan Williams Chief Product Officer
6th August, 2024 | 8 min read
We look at six key areas of rapid change, and how successful organizations use link analysis techniques to keep...