Product updates: faster layouts & localization
Dan Williams Chief Product Officer
7th December, 2021 | 2 min read
Serious improvements to KeyLines & ReGraph layout performance, plus a playground & localization support...
Dan Williams Chief Product Officer
7th December, 2021 | 2 min read
Serious improvements to KeyLines & ReGraph layout performance, plus a playground & localization support...
Dan Williams Chief Product Officer
31st August, 2021 | 3 min read
Find out what’s new in our latest KeyLines & ReGraph releases. Highlights include improved rectangular...
Kevin Naughten Senior Product Manager
15th June, 2021 | 8 min read
Interactive graph visualization just got easier! These 4 examples show how to customize hover and select behavior...
Dan Williams Chief Product Officer
8th December, 2020 | 4 min read
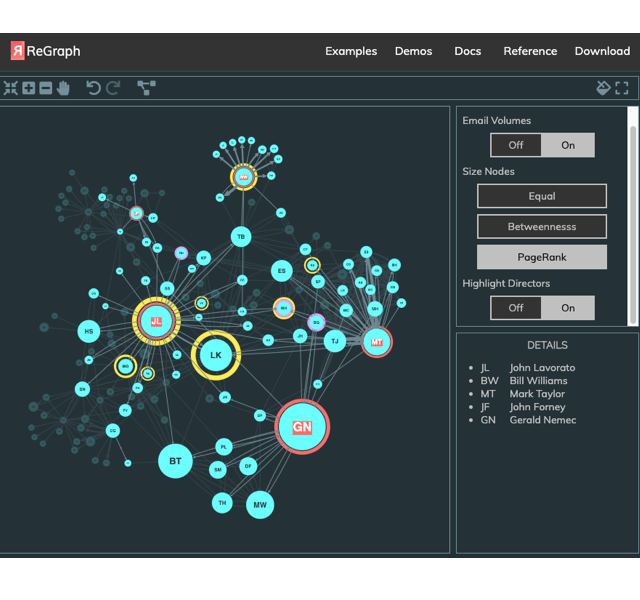
Our latest toolkit updates include rectangular combos, a revised KeyLines Neo4j tutorial, and ReGraph support for...
Catherine Kearns Content Strategist & Team Lead
17th July, 2020 | 2 min read
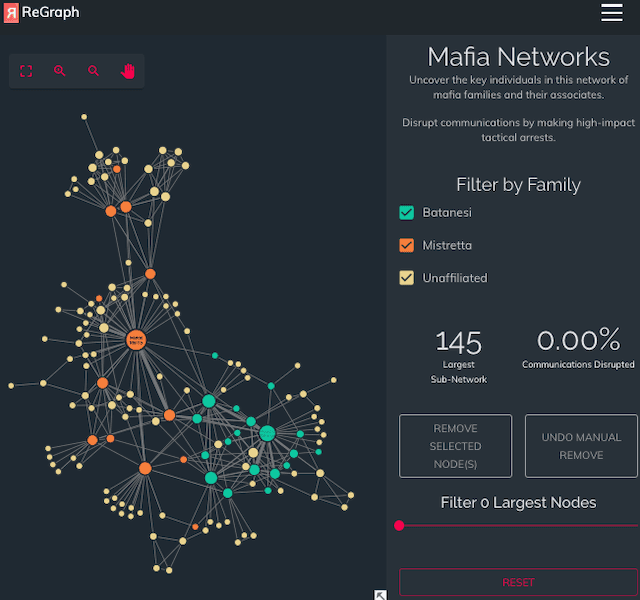
Cambridge Intelligence release the latest major version of ReGraph, the graph data visualization toolkit for React...
Kevin Naughten Senior Product Manager
16th July, 2020 | 4 min read
In ReGraph 2.0, the latest major version of our graph visualization toolkit for React developers, we present...
Catherine Kearns Content Strategist & Team Lead
23rd July, 2019 | 2 min read
After a successful Early Access Program, we’re proud to release v1.0 of ReGraph, our graph data visualization...
Catherine Kearns Content Strategist & Team Lead
7th May, 2019 | 2 min read
Cambridge Intelligence launches an Early Access Program for ReGraph – a brand new graph data visualization...
Registered in England and Wales with Company Number 07625370 | VAT Number 113 1740 61
6-8 Hills Road, Cambridge, CB2 1JP. All material © Cambridge Intelligence .
Privacy Policy | Security Framework
